Tag: DAX

DAX – Find the Items Ranked in Top n for Multiple Periods (with Dynamic Slicing)

One of my previous blog post introduces how to find the items which are ranked in top n for multiple periods, using the INTERSET and TOPN functions. However, that approach needs to hard-code the periods and the number of top items in the DAX scripts. This blog post introduces an approach that allows users to dynamically specify the periods and the number of top items to evaluate, using the interactive dashboard slicers.
a1

In this blog post, we will still use the Eurovision dataset as example that contains the rows of country-to-country votes for each year.

1

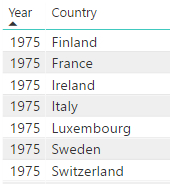
We will create four measures, including “Rank”, “In Top N (This Year)”, “In Top N (All Selected Years)”, and “All Selected Years in Top N”. These measures will be used in an evaluation context made of the combination of each year and each country. To build the evaluation context, we can use a Power BI table visual and add the “Year” and “ToCountry” columns from the Eurovision dataset to the table. The four measures will be added to the table later that evaluates the rank and whether in top n of each country in each year.
a2

A “Year” slicer will be added to the dashboard that allows users to filter the table by the selected years. Any number of years can be selected and the selected years can be consecutive or nonconsecutive.

a4

Measure – Rank

The first measure to create is the “Rank” measure that computes the ranks of the countries in each selected year.

Rank = RANKX(ALL(data[Country]), CALCULATE(SUM(data[Points])))

Measure – In Top N (This Year)

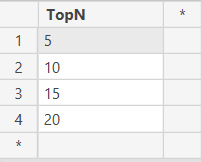
Based on the “Rank” measure, we will create the “In Top N (This Year)” measure that compute whether the current country is ranked in top n in the current year-country evaluation context. Here we need to allow users to dynamically specify the N (the number of top items) to evaluate. We can achieve that using a disconnected parameter table that defines the options for the N.
a3

In the DAX measure, we can get the user selected N value using VALUES function which will be compared to the “Rank” measure we created earlier to evaluate whether the current country is in top N in current year context.

In Top N (This Year) = 
    IF([Rank]<
        IF(HASONEVALUE('TopN'[Top N ]),
            VALUES('TopN'[Top N ]),
            10
        ), 1, 0)

We will then filter the table using the “In Top N (This Year)” measure that only keeps the countries ranked in the top N in at least one of the selected years.

a5.PNG

a7

Measure – In Top N (All Selected Years)

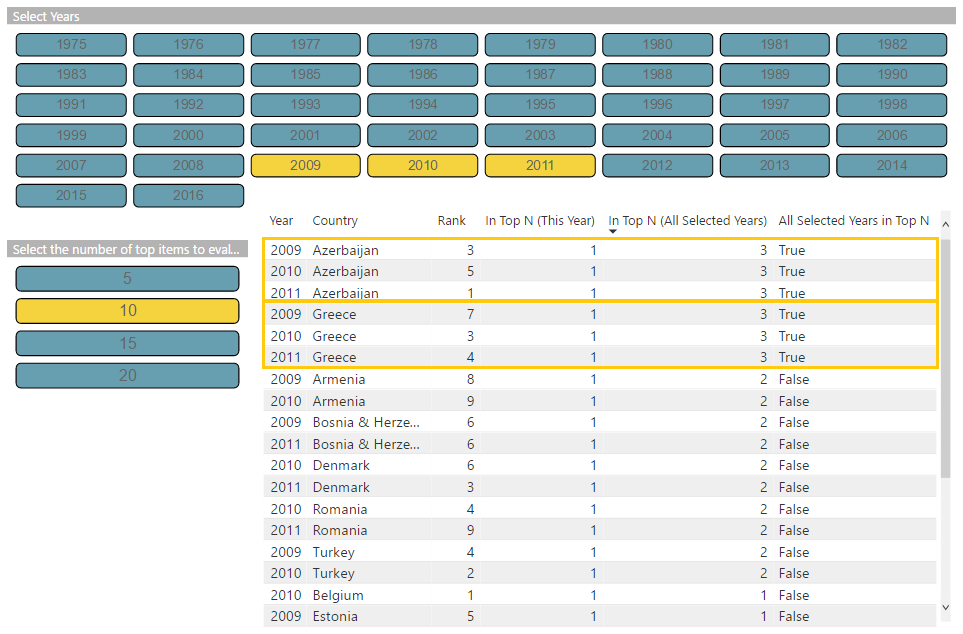
After we applied the filter on the “In Top N (This Year)” measure, the table only contains the rows of countries ranked in top N in at least one selected years. If we count the rows in the filtered table by a country, we will  get the number of selected years when this country is ranked in top N. This is what the “In Top N (All Selected Years)” measure will do.

In Top N (All Selected Years) = 
   CALCULATE(
        DISTINCTCOUNT(data[Year]),
        ALLSELECTED(data[Year])
    )

a8

Measure – All Selected Years in Top N

Now that we have the “In Top N (All Selected Years)” measure which tells us how many of the select years  a country is ranked in top 10, we can then calculate the total number of the select years and compare it to the “In Top N (All Selected Years)” measure. If the value of the “In Top N (All Selected Years)” measure is equal to the total number of selected years, that means the country is  ranked in top 10 in all the selected years.

All Selected Years in Top N = 
    VAR NumberOfSelectedYears = 
        CALCULATE(
            DISTINCTCOUNT(data[Year]),
            ALLSELECTED(data[Year]),
            ALLSELECTED(data[Country])
        )
    RETURN
        [In Top N (All Selected Years)] = NumberOfSelectedYears

a9.PNG

Please find the pbix file here.
DAX – Find the Items Ranked in Top n for Multiple Periods

UpdateI have suggested another approach here that allows users to dynamically specify the periods and the number of top items to evaluate, using the interactive dashboard slicers.

When analysing the best performers against a specific measure such as the best sold products, we sometimes need to take multiple periods into consideration. For example, we want to find the products that are not only ranked in Top 10 in this year but also in the other years. This blog post introduces how to achieve this type of calculations using DAX.

Here we will use Eurovision competition dataset as the example to compute the countries that are ranked in top 10 for both year 2015 and 2016.

The Eurovision competition dataset contains the rows of country-to-country votes for each year.

1

To find the countries which are ranked in top 10 for both year 2015 and 2016, we first compute the top 10 countries for each year, using CALCULATETABLE function to filter on the year and TOPN DAX function to return the set of countries ranked in top 10 for that year. Then we use the INTERSECT function to return the countries appearing in both years.

Top Countries In Both 2015 And 2016 = 
    INTERSECT(
        CALCULATETABLE(
            TOPN(10,
                SUMMARIZE(data, data[ToCountry]),
                CALCULATE(SUM(data[Points]))
             ),
            data[Year]=2016
        ),
        CALCULATETABLE(
            TOPN(10,
                SUMMARIZE(data, data[ToCountry]),
                CALCULATE(SUM(data[Points]))
             ),
            data[Year]=2015
        )
    )

The DAX script above will return the three countries which are ranked in top 10 for both year 2015 and 2016.

2

We can further improve the DAX script to make it return not only the name of the country but also the rank of the country for each year.

3

We can use the SUMMARIZECOLUMNS funciton combined with the RANKX function to computer the rank for all the countries and then use the NATURALINNERJOIN function to inner join the set we created earlier for computing the countries ranked in top 10 for both year 2015 and 2016.

Top Countries In Both 2015 And 2016 = 
  NATURALINNERJOIN(
    CALCULATETABLE(
        SUMMARIZECOLUMNS(
                        data[Year], 
                        data[ToCountry], 
                        "Rank", RANKX(ALL(data[ToCountry]), CALCULATE(SUM(data[Points])))
                        ), 
        data[Year]=2016 || data[Year]=2015
    ),
    INTERSECT(
        CALCULATETABLE(
            TOPN(10,
                SUMMARIZE(data, data[ToCountry]),
                CALCULATE(SUM(data[Points]))
             ),
            data[Year]=2016
        ),
        CALCULATETABLE(
            TOPN(10,
                SUMMARIZE(data, data[ToCountry]),
                CALCULATE(SUM(data[Points]))
             ),
            data[Year]=2015
        )
    )  
  )


DAX – Ranking with Hierarchy Drill-Down

Problem

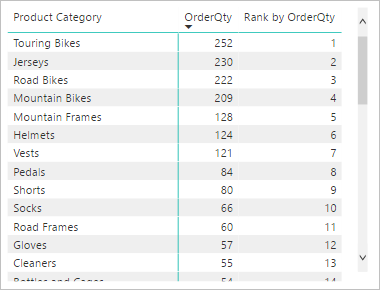
We can use the DAX RANKX function to return the rank of an item based on one of its numerical attribute. For example, we can create a measure using RANKX function to calculate the ranks of the product categories based on the order quantity within the product categories.

1t1

2

This measure will normally work fine until we drill the product hierarchy down to next level. As the rank measure is calculated at the parent-level, it will not work at the child-level.

5

Solution

To ensure the rank measure working at both parent-level and child-level, we need to calculate the rank accordingly depending on the what level the current filter context is at. We can use the DAX ISFILTERED function to evaluate current level.

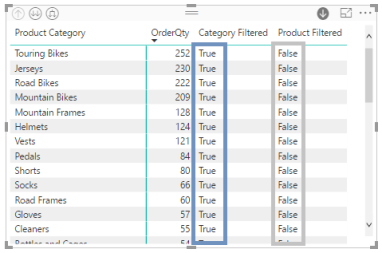
In the example below, we created two measures, [Category Filtered] and [Product Filtered], using the ISFILTERED function. At the product category level, we can see only the Product Category column is filtered.

1t1

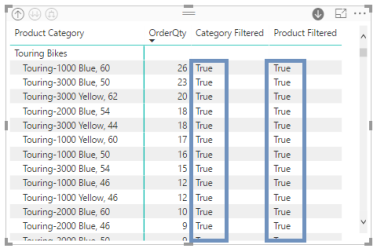
When we drill the table down to the product level, both product category and product columns are filtered.

2

We can now create a single measure to return the correct rank at both hierarchy level:

Rank by OrderQty =
VAR IsProductFiltered = ISFILTERED('Product'[Product Name])
VAR IsProductCategoryFiltered = ISFILTERED(ProductCategory[Product Category])
RETURN
IF (IsProductFiltered && IsProductCategoryFiltered,
RANKX(ALL('Product'[Product Name]), CALCULATE(SUM(SalesOrderDetail[OrderQty]))),
IF (NOT IsProductFiltered && IsProductCategoryFiltered,
RANKX(ALL(ProductCategory[Product Category]), CALCULATE(SUM(SalesOrderDetail[OrderQty]))),
BLANK()
)
)

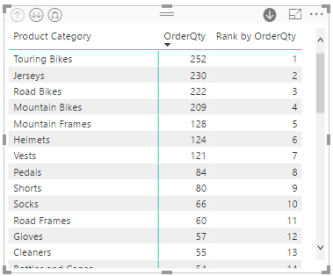
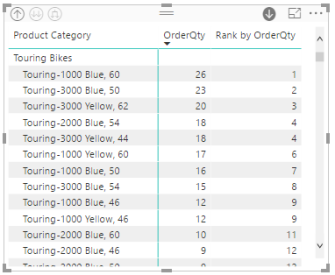
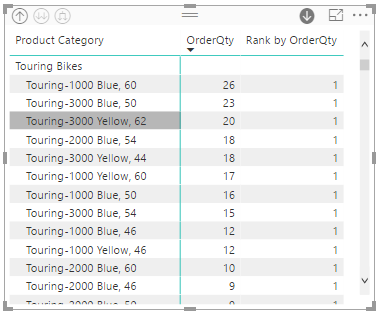
We first use the ISFILTERED function to evaluate which level is the current context at and then use the RANKX function to calculate the ranks accordingly. As the snapshot below shown, the rank will work fine at both levels.

34


DAX – Dynamically Showing Title by Slicer in Power BI

When building a Power BI report page for analysing data by a specific dimension (e.g., customer, product and category), we often need to dynamically show the title of currently selected item(s).

1t1

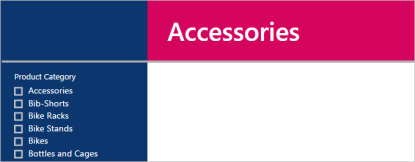
One trick to show the title based on the current filter context is to use Multi-Row Card visual (we can also use the single row Card visual. However, the single row Card visual doesn’t support custom text alignment yet). We can disable the left-side bar and change the style of the text to make it look more like a title.

3

Now we have the dynamical title based on the selected single item.

2

However, this approach doesn’t work when there is no item selected or when there are multiple items selected. When there is no item selected, the Multi-Row Card visual will display all the items. As the size of the Multi-Row Card visual is set to be large enough for only a single item, only the first item is visible. The rest of items are still showing but have been cut out.

5

The title will be misleading when there is no item selected. We expect to see something like “All Categories Selected” or “No filter applied” as title.

6

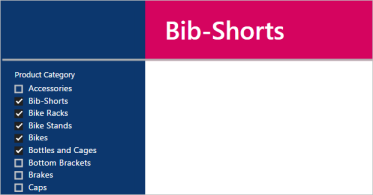
We meet similar problem when there are multiple items selected where only the first selected item will be visible in the title.

7

Instead, the title needs to be able to let viewers aware that multiple items have been selected and how many of them.

ml1.PNG

Now we have gone through the requirements and we need an solution to be able to handle all the three scenarios: single item selection, no selection and multiple item selection. We can create a single measure to cover all the three scenarios:

Product Category Title = 

  IF (COUNT('SalesLT ProductCategory'[Product Category])=1, 
    VALUES('SalesLT ProductCategory'[Product Category]),
    
    IF (COUNT('SalesLT ProductCategory'[Product Category])=
              CALCULATE(COUNT('SalesLT ProductCategory'[Product Category]), 
                           All('SalesLT ProductCategory'[Product Category])),
        "All Categories Selected",
        
        MIN('SalesLT ProductCategory'[Product Category]) & " and the other "
                & COUNT('SalesLT ProductCategory'[Product Category])-1 & " categories"
    )
   )

Firstly, we check whether only a single item is selected, if so, we return the single selected value, if not, we check whether all items are selected, if so, we return the text showing all items are selected in the current filter context, if not, that means multiple items have been selected, we build a text string to show the name of the first item and the count of the rest of items.