As discussed in the previous blog posts in my Data Quality Improvement series, the key for successful data quality management is the continuous awareness and insights of how fit your data is being used for your business. Data quality assessment is the core and possibly the most challenging activity in the data quality management process. This blog post discusses the requirements and core elements of rule-based data quality assessments.
Requirements of Data Quality Assessments
What do we want from data quality assessments? In short, we want the data quality assessments to tell us the level of fitness of our data for supporting our business requirements. This statement implies two core requirements of data quality assessments:
- Data quality assessments need to evaluate the quality of data in a business context. Quality is an abstract and multifaceted concept. The criteria to decide the data quality is based on what is the business required for good data.
- Data quality assessments need to be able to evaluate the level of data fitness. As mentioned above, continuous monitoring is the key to successful data quality management. We need a tool to understand the trend and degree of the data quality evolving.
Rule-Based Data Quality Assessments
For those two requirements of data quality assessments mentioned above, let’s have a think about what we will need in order to fulfil those requirements.
Firstly, to evaluate the fitness of a set of data to a business requirement, we first need to know the criteria the business is using to evaluate whether or not the data is fit to use. A simple and good representation of the business-oriented criteria is a set of constraint-based rules. The fitness can be decided by checking whether or not the constraints are complied. The constraint-based rules not only simplify the representation and organisation of facets of data quality but also acts as an effective common language between the persona involved in the data quality management process.
Secondly, we need an effective representation of the level of data fitness. This representation needs to be able to describe the degree of the data quality changes and also the distances to the different data quality status (e.g., good, ok, bad, very bad) expected by the business. Yes, nothing is better than a numerical value that is normally referred to as a DQ metric. DQ metrics are widely used and studied in both commercial and research communities and they are often interpreted from different angles. Below is my definition of DQ metrics:
- It represents the quality of a specific attribute of a set of data
- It is a numerical number in a fixed range (e.g. 0..1 or 0..100)
- It can represent data quality at a different level
As mentioned before, I personally consider data quality assessment as the most challenging activity in the data quality management process. At the same time, I think defining DQ metrics is the most challenging activity in the data quality assessment process. To ensure the DQ metrics you defined accurately representing the data quality, not only do you need to find a good formula for calculating the metrics, but also you need to take all sorts of business factors into consideration, such as business impacts, urgencies, and criticalities.
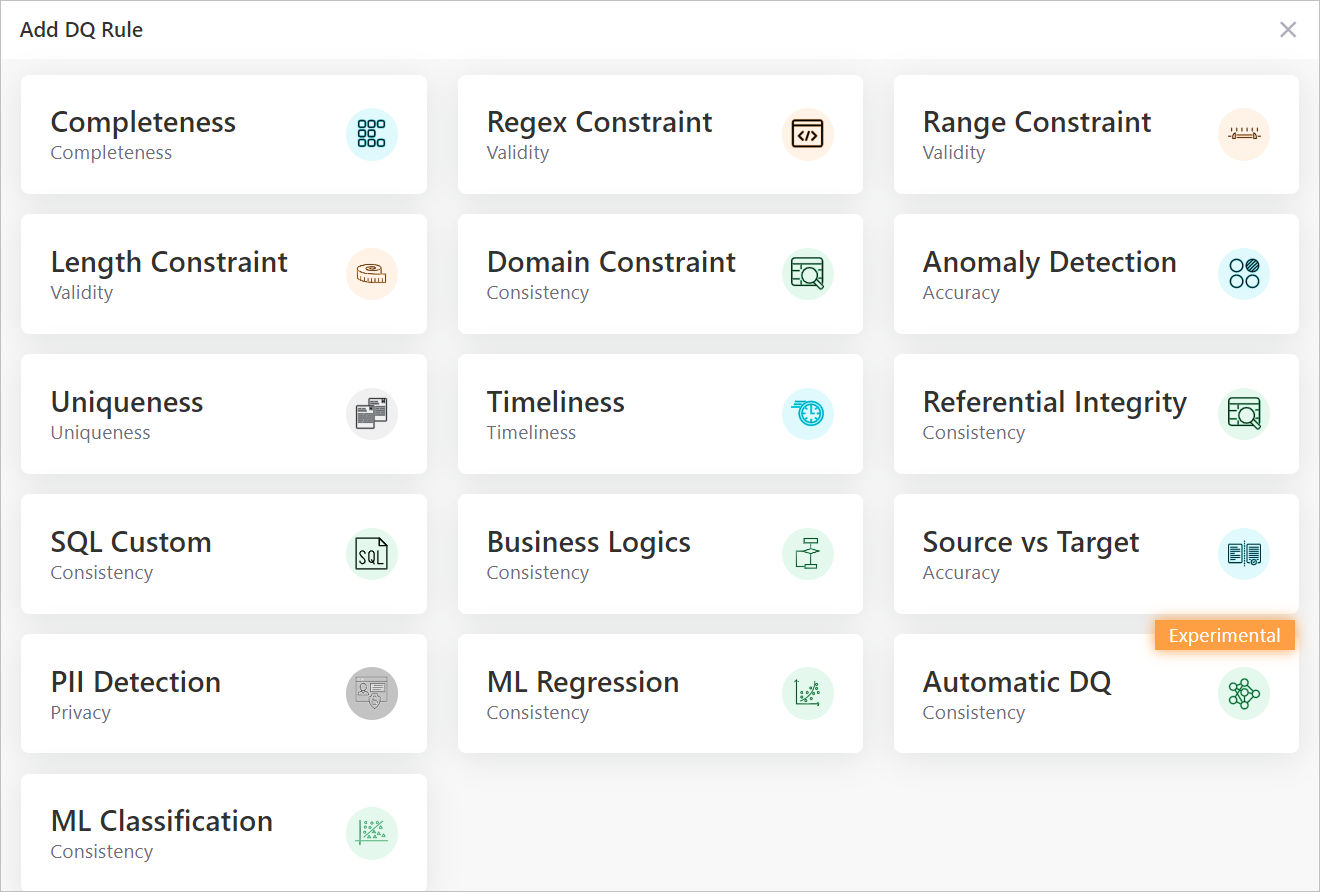
Elements of Data Quality Rules
In the rest of this blog post, I am going to explore the core elements of data quality rules and how they could be defined to support data quality assessments. The dqops DQ studio (the app I have been building for one of my personal R&D initiatives) will be used as examples for discussing those elements of DQ rules.
A data quality rule needs to contain the following five core elements:
- Business Constraints
- Metric Formula
- Alert Thresholds
- DQ Dimension
- Metric Aggregation Algorithm
Business constraints specify the conditions for a set of data to qualify to be fit to use in a business scenario. Let’s take the Regular Expression constraint rule in the dqops DQ Studio as an example (as shown in the snapshot below). This rule is used to evaluate whether a column value in a dataset complies with a format specified by a regular expression. For example, a column that stores France postcodes is fit to use only when its values comply with the specified France postcode format.
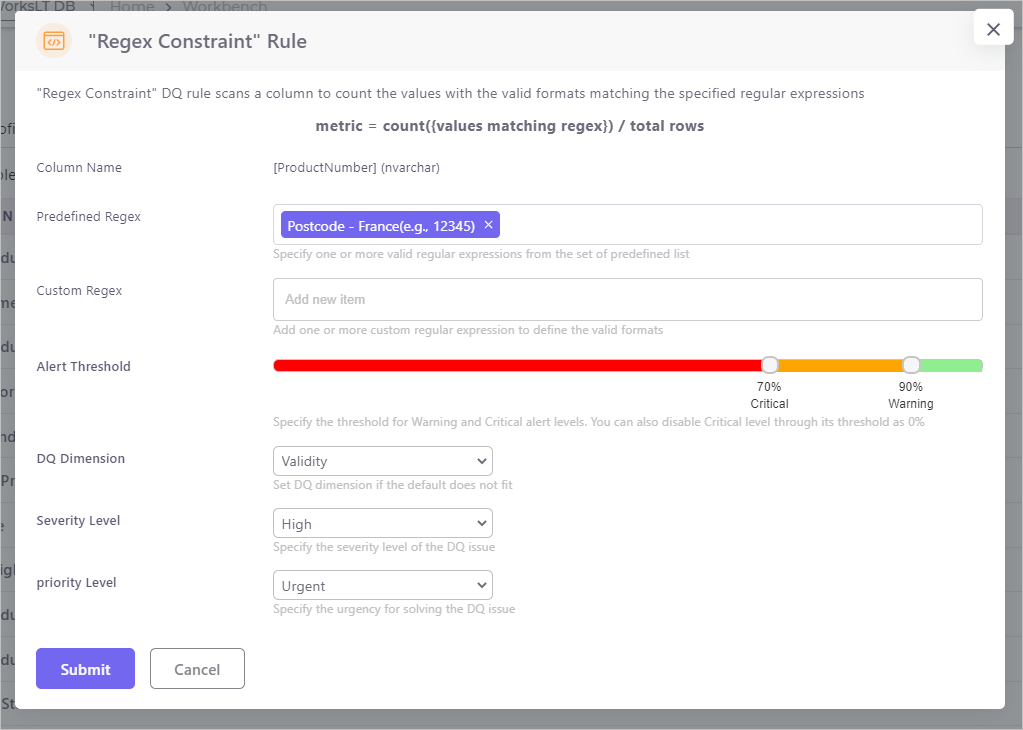
DQ metrics are the numerical representations of an aspect of the quality of a dataset. The Metric formula defines the calculation to determine the number. In the Regular Expression constraint rule example, the metric could be defined as the count of column values that comply with the regex divided by the count of rows in the dataset.
In the example above, the result calculated from the metric formula is a number between 0 to 1 or in the format of 0% to 100%. However, a number alone cannot tell whether the set of data is fit or not in the given business context. Alert Threshold is the tool to make the cut. In the Regular Expression constraint rule example, as the snapshot above shown, a warning threshold could be set as 90% while a critical threshold could be set as 70%. That means the quality of the data set (for the format validity aspect defined in regular expressions) is ‘Good’ when the metric number is over 90% and is ‘OK’ when it is between 70% and 90% and is not fit when the number is under 70%. Alert thresholds can be manually defined based on the business/DQ analysts experiences or be automatically defined based on the historic distribution of the observed values.

Another element of a DQ rule is the Dimension that the DQ rule is evaluating into. As I mentioned in my previous blog post, I have a rather mixed feeling about DQ dimension. On one hand, DQ dimensions are context-dependent that could be interpreted differently in a different context by different people. On the other hand, DQ dimensions create a common language to express and classify the quality of data when quality itself is an abstract concept that could represent many aspects. To solve this dilemma, as I suggested before, instead of pursuing a global consensus on the universal DQ dimensions in any context indifferently, the DQ dimensions need to be defined and interpreted based on the expected purposes of the data and the consensus on the DQ dimension meanings need to be made in an internal, domain-specific environment. In the dqops DQ Studio, the dimension of a DQ rule is not pre-defined, but instead, business/DQ analysts are allowed to specify dimension for a DQ rule based on their interpretations of the dimension in their organisation.
The last but not least element of a DQ rule is the Metric Aggregation Algorithm. Data quality needs to be assessed and analysed at different granularity levels, such as column-level, dataset-level, database-level, domain-level, up to organisation-level. To represent the data quality using metrics at different levels, the low-level metrics need to be aggregated into the higher level. The algorithm for aggregating the metrics needs to take the business impacts as weighted variables, such as severity level and priority level of DQ issues.