Category: SSIS/SSAS/SSRS/MDX

SSIS in Azure #3 – Schedule and Monitor SSIS Package Execution using ADF V2

*The source code created for this blog post can be found here.

In the previous blog posts in the SSIS in Azure series, we created a SSIS package to periodically ingests data from Azure SQL database to Azure Data Lake Store and deployed the package in the Azure-SSIS Integrated Runtime. Up to this point, we have achieved two goals in the SSIS in Azure series:

  • Using SSIS to move data between cloud storages
  • Host and run SSIS packages in cloud

The last goal we need to achieve is to schedule the execution of the SSIS package in cloud. Traditionally, we can schedule the SSIS package execution by creating a SQL Server Agent job. However, we can only do that through an on-premises SQL Server instance or provision a SQL Server vm in Azure. Thanks to the support of Stored Procedure activity in ADF, we can now schedule the SSIS package execution using a cloud-based ADF pipeline. This blog post will walk through the steps to achieve that.

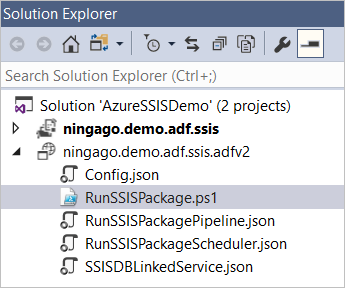
You can find the source code created for this blog post in my Github. The ningago.demo.adf.ssis.adfv2 project contains the json and powershell files to create the ADF pipeline.
4.PNG


The key to this solution is to call the sp_executesql stored procedure in the RunSSISPackagePipeline pipeline that execute the sql script for triggering the SSIS package execution. We can define a Stored Procedure activity in the pipeline to call the sp_executesql stored procedure and pass in the sql script for triggering the SSIS package execution as parameter.

5

We don’t have to manually author the sql script from scratch, but instead we can generate the script using SSMS. First, we connect to the SSISDB catalog in our Azure-SSIS integrated runtime (please refer to SSIS in Azure #2 for how to do that), select the SSIS project or package we can execute, and click the Execute button to open the Execute Package dialog window.

6

On the Execute Package dialog window, we select the package to execute and also set a value (can be any value) for the package parameter (the reason is set any value to the parameter is to ensure the parameter setting statement will be generated in the sql script).

2

We then click the “Script” button on the top-left that will generate the sql script for executing the selected SSIS package.

3

We can then copy the script into the stored procedure activity defined in the RunSSISPackagePipeline pipeline.

5

As you may have noticed that the SSIS package parameter, DateScliceToLoad, has been manually set by us with a random value. The next step we need to take is to pass the date of pipeline run into the sql script in order to make the SSIS package only move the data in the give day. Firstly, we need to define the “scheduledRunTime” parameter in the RunSSISPipeline which will receive the scheduled pipeline run time from the pipeline trigger we will create later.

6.PNG

In the sql script we just generated to trigger SSIS package execution, we replace the random date we have manually set with the ADF expression which points to the scheduleRunTime parameter in the pipeline.

7.PNG

Next, we will need to create the trigger json file to schedule the execution of the pipeline. After we specify the pipeline to execute in the trigger file, we need to pass the scheduledTime of the trigger which is a system variable to the scheduledRunTime parameter defined in the pipeline.

{
  "properties": {
    "name": "RunSSISPackageScheduler",
    "type": "ScheduleTrigger",
    "typeProperties": {
      "recurrence": {
        "frequency": "Hour",
        "interval": 1,
        "startTime": "2018-01-07T00:00:00-22:00"
      }
    },
    "pipelines": [
      {
        "pipelineReference": {
          "type": "PipelineReference",
          "referenceName": "RunSSISPackagePipeline"
        },
        "parameters": {
          "scheduledRunTime": "@trigger().scheduledTime"
        }
      }
    ]
  }
}

After we have created the json files to define linked service, pipeline and the trigger, we need to deploy them into our data factory instance. As the V2 version of ADF does not support deployment through UI yet, we need to create a deployment scripts using PowerShell.

$DataFactoryName = "ninjago3843adf"
$ResourceGroupName = "SSIS"

Set-AzureRmDataFactoryV2LinkedService -DataFactoryName $DataFactoryName -ResourceGroupName $ResourceGroupName -Name "SSISDBLinkedService" -File ".\SSISDBLinkedService.json"
Set-AzureRmDataFactoryV2Pipeline -DataFactoryName $DataFactoryName -ResourceGroupName $ResourceGroupName -Name "RunSSISPackagePipeline" -DefinitionFile ".\RunSSISPackagePipeline.json"

Stop-AzureRmDataFactoryV2Trigger -ResourceGroupName $ResourceGroupName -DataFactoryName $DataFactoryName -Name "RunSSISPackageScheduler"
Set-AzureRmDataFactoryV2Trigger -ResourceGroupName $ResourceGroupName -DataFactoryName $DataFactoryName -Name "RunSSISPackageScheduler" -DefinitionFile ".\RunSSISPackageScheduler.json"
Start-AzureRmDataFactoryV2Trigger -ResourceGroupName $ResourceGroupName -DataFactoryName $DataFactoryName -Name "RunSSISPackageScheduler"

After the pipeline is deployed and scheduled by the trigger, the pipeline will execute our SSIS package based on the schedule.

8.PNG


SSIS in Azure #2 – Deploy SSIS Packages to Azure-SSIS Integration Runtime in ADF V2

In the first blog post of the SSIS in Azure series, I gave a demonstration on how to create SSIS packages to move data in cloud, using a common use case that periodically ingests data from Azure SQL database to Azure Data Lake Store.  In the pre-ADF V2 era, we can only deploy SSIS packages in on-premises SQL Servers or SQL Servers in Azure VM. Thanks to the Azure-SSIS integration runtime that is available for public preview in Azure Data Factory V2, we can now directly deploy and execute our SSIS packages in Azure without needing to provision and manage an Azure SQL Server VM (One thing to note, under the hood, Azure-SSIS integrated runtime itself is a cluster of Azure VMs that are dedicated to run SSIS packages).

This blog post will walk through the steps to deploy, execute and monitor the SSIS package we have created in previous blog post in the Azure-SSIS integration runtime.

First of all, we need to have an Azure-SSIS integration runtime created in our Azure tenant. This can be achieved using the PowerShell scripts provided by Microsoft.

I have met an issue when running the scripts. Here is the hint in case you run into the same issue. If the Set-AzureRmDataFactoryV2 and the Set-AzureRmDataFactoryV2IntegrationRuntime cmdlet in the PowerShell scripts fail to execute and raise the “HTTP Status Code: NotFound” error even after you have installed the Azure PowerShell modules (we can see the AzureRM.DataFactoryV2 module is installed after checking the C:\Program Files\WindowsPowerShell\Modules folder), it may be caused by the incompatible versions between AzureRM modules. As the “Install-Module AzureRM -AllowClobber” cmdlet only installs the Azure modules that are not already installed in your computer, the Azure modules on which the AzureRM.DataFactoryV2 module is dependent are not updated. The simplest solution to this issue is to remove all AzureRM modules in the C:\Program Files\WindowsPowerShell\Modules folder and then run the Install-Module AzureRM -AllowClobber cmdlet.

After the PowerShell scripts is successfully run, an Azure Data Factory V2 instance and a SSISDB Azure SQL database are created in the resource group we specified in the scripts.

2

The SSISDB is the Azure-hosted SSIS catalog where you can deploy your SSIS packaged into. We can use SSMS to connect to the SSISDB. On the Connect to Server dialogue in the SSMS, we need to specify the Server name as the Azure SQL server where the SSISDB SQL database is hosted.

3

After we specified the server name and the login details, don’t click the Connect button to connect to the SQL Server, but instead click the Options button to open the Connection Properties tab. On the Connection Properties tab, set “Connect to database” field as SSISDB database. This settings will allow you to connect to the SSISDB SSIS catalog after clicked the Connect button.

4

5

We can deploy our SSIS package into the SSISdB catalog either by using Deploy Project option in SSMS

6

or using Deploy option in you SSIS SSDT project in Visual Studio.

7

Both options will launch the Integration Services Deployment Wizard dialog to guide us through the steps for the SSIS package deployment.

8

13

We can execute the deployed SSIS packages in SSMS by right-clicking a SSIS project or SSIS package to launch the Execute Package dialog. The SSIS package we have created to periodically load data from Azure SQL database to Azure Data Lake requires a DateSclieToLoad parameter passed in that specifies which day of data to move. We can manually set the value of this parameter in the Execute Package dialog.

9

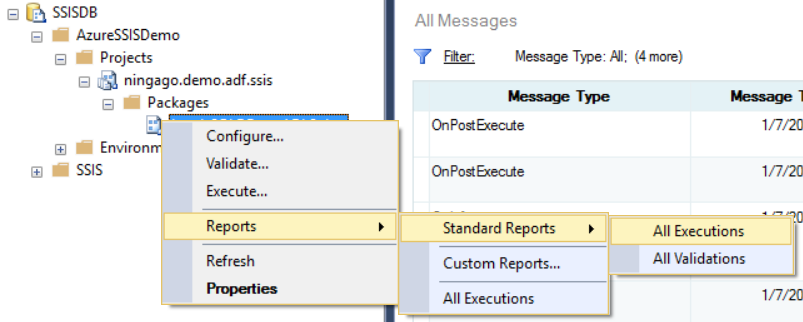
We can also monitor the SSIS package executions in SSMS through the SSIS catalog reports.

14.PNG

1112

Up to this point, we have created the Azure-SSIS Integration Runtime and deployed our SSIS package into the runtime. We can execute the package and monitor the execution results manually in SSMS. In next blog post, I will walk through the steps to schedule the SSIS package execution using an ADF V2 pipeline.  The ADF V2 pipeline will be scheduled to execute every day. The date of the current pipeline execution will be passed into the SSIS package, and the SSIS package will move the data by the given date parameter.


Building SharePoint Solutions using SQL Server Reporting Services

Building SharePoint Solutions using SQL Server Reporting Services

There are many options available for building SharePoint-based applications. This blog post introduces another non-traditional option –
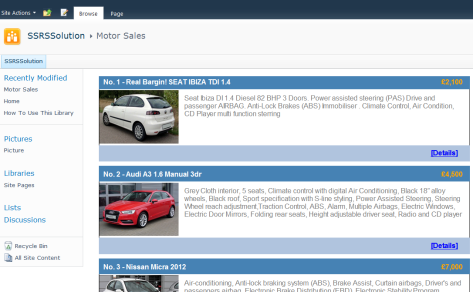
building SharePoint application using SQL Server Reporting Services. To introduce this approach, I will demo how to create a simplified second-hand car listing solution (within less than one hour):

S4

S5

Firstly, we go to a Sharepoint site and create a Sharepoint list to store the details of the cars. Then we open BIDS and create a report project. Within this project, we add a Sharepoint List data source and set it to connect to the Sharepoint site where the Cars list was created.

S1

Then, we need add a data set to retrieve data from the Sharepoint Cars list. We can use the query designer to build the query.

S2

The sharepoint CAML query is then generated and will be used to query Sharepoint list.

S3

After we have created the dataset, we had the fields ready for creating the report.

S6

We drag a table onto the report body and only keep one column, and then add a ‘Rectangle’ into the row cell and use the ‘Rectangle’ as the canvas to build the car listing item template.

S7

When users click the ‘Details’ link at bottom right corner on each car item, we expect the report to drill through to the car details report. Firstly, we add a new report (the car details report) into the BIDS project, and then create a parameter called ‘CarSaleID’ which will receive the item id passed through from the clicked car item.

S10

Then, we need create a dataset to get the car item from sharepoint list filtered by the given parameter. After we had the dataset ready, we can start to build the car item details template.

S8

After the car details report has been created, we go back to the car list report and create an Action on the ‘Details’ link which trigger the drill through to the details report with the car item id as the drill through parameter.

SP12

Now, we have had our reports created in BIDS and we need deploy to either report server (in Native mode) or SharePoint site (in Integrated mode). After the reports have been deployed, we could add Report Viewer Web Part to host the report on SharePoint page. The Report Viewer Web Part shipped with Integrated mode offers more features compared to the Report Viewer web part in Native mode. For example, we could connect filter web parts to Report Viewer Web Part (integrated version) to dynamically set the report parameters.

Creating PowerView Style Filters on SQL Server Reporting Services Reports

Creating PowerView Style Filters on SQL Server Reporting Services Reports

PowerView, the new commer of Microsoft reporting tools family, empowers report builders to create eye-catching reports with wow-factors in a rather simple way.

powerview_filter_01

One nice feature offered by PowerView is the image-based filter.

powerview_filter_02

Obviously, it would produce much better user experience compared to the drop down style filter in SSRS. Not only it looks much nicer, but also users don’t have to click the “View Report” button every time they changed their selections.

powerview_filter_04

It would give SSRS reports many wow-factors if we could add this PowerView style filters on SSRS reports. In this post, I will go through the steps to build up a PowerView style filter like the snapshot shown below.

powerview_filter_03

Firstly, we need have our report body ready with some charts or tables. As an example, I create a chart connecting to the sample Adventure Works cube and presenting the sale amounts of each product sub-category under a primary category which will be selected by end-users on our PowerView style filter. This is the query to fetch the data required by the chart.

SELECT
	NON EMPTY { [Measures].[Reseller Sales Amount]} ON COLUMNS,
	NON EMPTY { ([Product].[Product Categories].[Product].ALLMEMBERS ) } ON ROWS
FROM
	(SELECT
		STRTOSET(@ProductCategory, CONSTRAINED) ON COLUMNS
	FROM [Adventure Works])

As you can see above, a parameter (“@ProductCategory”) need to be passed into the query. We need define the parameter on report level and get the available values using the following query.

WITH
	MEMBER [Measures].[ParameterCaption] AS
		[Product].[Category].CurrentMember .MEMBER_CAPTION
	MEMBER [Measures].[ParameterValue] AS
		[Product].[Category].CurrentMember.UniqueName
	MEMBER [Measures].[ParameterLevel] AS
		[Product].[Category].CurrentMember .Level .Ordinal
SELECT
	{ [Measures].[ParameterCaption], [Measures].[ParameterValue], [Measures].[ParameterLevel] } ON COLUMNS,
	{[Product].[Product Categories].Children} ON ROWS
FROM [Adventure Works]

Then we add a horizontal list onto the table which is the host of the PowerView style filter (Creating horizontal list is out of scope of this post. Please just google it and tons of articles are there about this topic). On the item template, add an image placeholder and a textbox placeholder.

powerview_filter_06

We then need a dataset to get the product categories and also the image associated with each category. Unfortunately, there is no image information associating with primary category stored in the sample Adventure Works DW database. Therefore, I have added an Image column to the DimProductCategory table and assign a sample image for each category. The query below fetch the category name and image.

SELECT [ProductCategoryKey]
      ,[EnglishProductCategoryName]
      ,[Image]
FROM [dbo].[DimProductCategory]

After the product category image placeholder and name placeholder on the horizontal list are associated with the dataset. Right-click the image placeholder, go to properties and select the Action panel. Create a “Go to Report” type action and select the current report as the destination report.

powerview_filter_07

On the parameter section, select the ProductCategory parameter and set the value as:

 powerview_filter_08

After that, we have our PowerView style filter on the SSRS report.

powerview_filter_03


MDX #5 – Product Sales Growth Analysis

Business Question 1: What are the top(n) products with highest sales growth  from previous year in each sales territory?

M01

Firstly, we need get the sales of previous year using ParallelPeriod method and then calculate the sales growth (%) by comparing the sales of current year aganist previous year. We will then combining GENERATE and TOPCOUNT functions to get the top (n) products within each sale territory.

WITH
MEMBER [Measures].[Sales Prev Year] AS
AGGREGATE
(
ParallelPeriod
(
[Date].[Calendar].[Calendar Year], 1, [Date].[Calendar].CURRENTMEMBER

)
,[Measures].[Sales Amount]
)

MEMBER [Measures].[Sales Current Year] AS
AGGREGATE
(
[Date].[Calendar].CURRENTMEMBER, [Measures].[Sales Amount]
)

MEMBER [Measures].[% Sales Growth] AS
IIF ([Measures].[Sales Prev Year]=0, NULL,
([Measures].[Sales Current Year] - [Measures].[Sales Prev Year])/[Measures].[Sales Prev Year]
), FORMAT_STRING="Percent"

SELECT {
[Measures].[Sales Prev Year],
[Measures].[Sales Current Year],
[Measures].[% Sales Growth]
} ON COLUMNS,
NON EMPTY{
GENERATE(
[Sales Territory].[Sales Territory].[Country].MEMBERS
,TOPCOUNT(
[Sales Territory].[Sales Territory].CURRENTMEMBER*
[Product].[Product Categories].[Product].members, 3, [Measures].[% Sales Growth]
)
)
} ON ROWS

FROM [Adventure Works]
WHERE [Date].[Calendar].[Calendar Year].&[2008]


Business Question 2: What are the  products having sales growth over 10% in UK

M02

To get the set of products having sales growth over 10%, we need use FILTER function to filter on the products and set the condition as [Measures].[% Sales Growth]>0.1

WITH
MEMBER [Measures].[Sales Prev Year] AS
AGGREGATE
(
ParallelPeriod
(
[Date].[Calendar].[Calendar Year], 1, [Date].[Calendar].CURRENTMEMBER

)
,[Measures].[Sales Amount]
)

MEMBER [Measures].[Sales Current Year] AS
AGGREGATE
(
[Date].[Calendar].CURRENTMEMBER, [Measures].[Sales Amount]
)

MEMBER [Measures].[% Sales Growth] AS
IIF ([Measures].[Sales Prev Year]=0, NULL,
([Measures].[Sales Current Year] - [Measures].[Sales Prev Year])/[Measures].[Sales Prev Year]
), FORMAT_STRING="Percent"

SET [Products with Sales Growth over 10%] AS
Filter
(
EXISTING
NONEMPTY ([Product].[Product Categories].[Product].members,
[Measures].[Sales Prev Year])
, [Measures].[% Sales Growth]>0.1
)

SELECT {
[Measures].[Sales Prev Year],
[Measures].[Sales Current Year],
[Measures].[% Sales Growth]
} ON COLUMNS,
{
Order
(
[Products with Sales Growth over 10%]
, [Measures].[% Sales Growth]
, BDESC
)
} ON ROWS

FROM [Adventure Works]
WHERE ([Date].[Calendar].[Calendar Year].&[2008],
[Sales Territory].[Sales Territory].[Country].&[United Kingdom])


Business Question 3: Linear regression trends based on the sales on the previous 12 months

52

51

A built-in MDX function LinRegPoint has been provided for Linear Regression Analysis. Firstly, we need get the last 12 months (in the example below, we presume current month is Sep, 2007) which will be shown on the x-axis on a chart. Then, we need get the rank of the monthes which represents the value on the x-axis. Next, we need call the LinRegPoint function to calculate the value of the y-intercept in the regression line.

WITH
//presume current month as Sep, 2007 as demo
SET [Last 12 Months] AS
{[Date].[Calendar].[Month].&[2007]&[9].LAG(12):[Date].[Calendar].[Month].&[2007]&[9]}

MEMBER [Measures].[Month Rank] AS
RANK(
[Date].[Calendar].CURRENTMEMBER
, ORDER ([Last 12 Months], [Date].[Calendar].CURRENTMEMBER.properties("key"), BASC)
)

MEMBER [Measures].[Liner Regression Trend Point] AS
LinRegPoint([Measures].[Month Rank]
,[Last 12 Months]
,[Measures].[Sales Amount]
,[Measures].[Month Rank])
,FORMAT_STRING = "Currency"

MEMBER [Measures].[MonthValue] AS
[Date].[Calendar].CURRENTMEMBER.membervalue

Select {[Measures].[MonthValue],[Measures].[Sales Amount]
,[Measures].[Liner Regression Trend Point]} on columns,
[Last 12 Months] on rows

from [Adventure Works]

Creating SSAS Partitions through Directly Modifying XML Source file

I have met a very strange issue when I was creating SSAS partitions using Partition Wizard in SSDT 2012. I have gone through all the steps in Partition Wizard successfully, but no partition was created although everything seems running fine. Although I have managed to create the partitions in the SQL Server Management Studio with no problem, I need create the partition definition in the SSDT for source control purpose. After quite a number of tries on the Partition Wizard, I finally gave up the approach, and decide to directly modify the backend xml source file of the partition definitions to create the new partitions.

Firstly, the partitions are not defined in the .cube file but instead in a separate .partition file which defines all the partitions in all the measure groups. In the .partition file, find the <MeasureGroup> within which you want to add the new partition, and add the script like this (see the snapshot below) into the <Partitions> tag.

C1

After you have added the partition definitions into the .partition file, you need to reopen the cube in SSDT to reload the partition tab, and then you will see the new partitions have shown up on the partition tab.