Business Question 1: What are the top(n) products with highest sales growth from previous year in each sales territory?
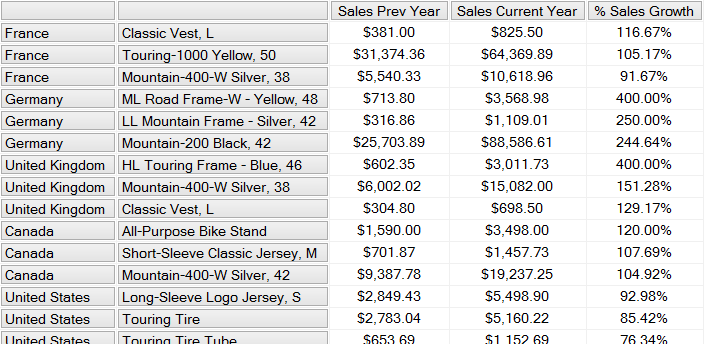
Firstly, we need get the sales of previous year using ParallelPeriod method and then calculate the sales growth (%) by comparing the sales of current year aganist previous year. We will then combining GENERATE and TOPCOUNT functions to get the top (n) products within each sale territory.
WITH
MEMBER [Measures].[Sales Prev Year] AS
AGGREGATE
(
ParallelPeriod
(
[Date].[Calendar].[Calendar Year], 1, [Date].[Calendar].CURRENTMEMBER

)
,[Measures].[Sales Amount]
)

MEMBER [Measures].[Sales Current Year] AS
AGGREGATE
(
[Date].[Calendar].CURRENTMEMBER, [Measures].[Sales Amount]
)

MEMBER [Measures].[% Sales Growth] AS
IIF ([Measures].[Sales Prev Year]=0, NULL,
([Measures].[Sales Current Year] - [Measures].[Sales Prev Year])/[Measures].[Sales Prev Year]
), FORMAT_STRING="Percent"

SELECT {
[Measures].[Sales Prev Year],
[Measures].[Sales Current Year],
[Measures].[% Sales Growth]
} ON COLUMNS,
NON EMPTY{
GENERATE(
[Sales Territory].[Sales Territory].[Country].MEMBERS
,TOPCOUNT(
[Sales Territory].[Sales Territory].CURRENTMEMBER*
[Product].[Product Categories].[Product].members, 3, [Measures].[% Sales Growth]
)
)
} ON ROWS

FROM [Adventure Works]
WHERE [Date].[Calendar].[Calendar Year].&[2008]
Business Question 2: What are the products having sales growth over 10% in UK
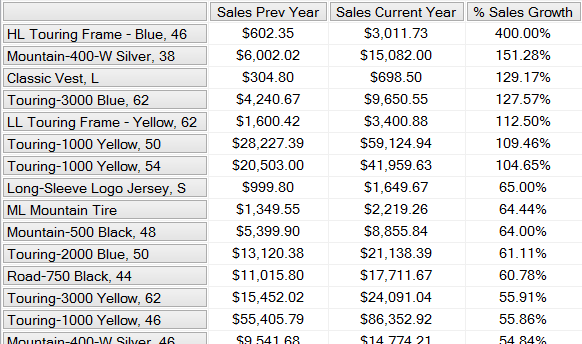
To get the set of products having sales growth over 10%, we need use FILTER function to filter on the products and set the condition as [Measures].[% Sales Growth]>0.1
WITH
MEMBER [Measures].[Sales Prev Year] AS
AGGREGATE
(
ParallelPeriod
(
[Date].[Calendar].[Calendar Year], 1, [Date].[Calendar].CURRENTMEMBER

)
,[Measures].[Sales Amount]
)

MEMBER [Measures].[Sales Current Year] AS
AGGREGATE
(
[Date].[Calendar].CURRENTMEMBER, [Measures].[Sales Amount]
)

MEMBER [Measures].[% Sales Growth] AS
IIF ([Measures].[Sales Prev Year]=0, NULL,
([Measures].[Sales Current Year] - [Measures].[Sales Prev Year])/[Measures].[Sales Prev Year]
), FORMAT_STRING="Percent"

SET [Products with Sales Growth over 10%] AS
Filter
(
EXISTING
NONEMPTY ([Product].[Product Categories].[Product].members,
[Measures].[Sales Prev Year])
, [Measures].[% Sales Growth]>0.1
)

SELECT {
[Measures].[Sales Prev Year],
[Measures].[Sales Current Year],
[Measures].[% Sales Growth]
} ON COLUMNS,
{
Order
(
[Products with Sales Growth over 10%]
, [Measures].[% Sales Growth]
, BDESC
)
} ON ROWS

FROM [Adventure Works]
WHERE ([Date].[Calendar].[Calendar Year].&[2008],
[Sales Territory].[Sales Territory].[Country].&[United Kingdom])
Business Question 3: Linear regression trends based on the sales on the previous 12 months
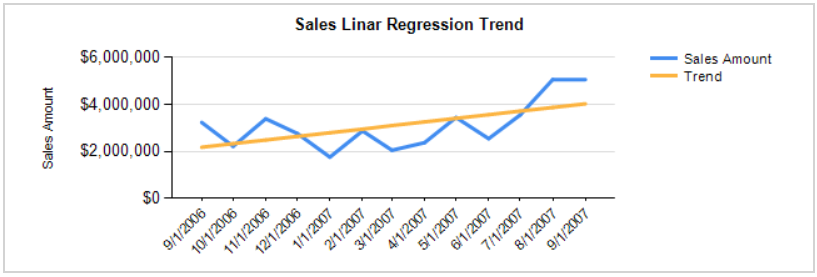
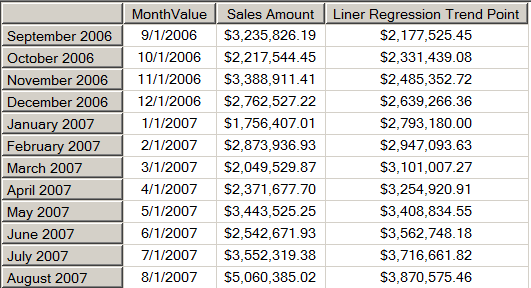
A built-in MDX function LinRegPoint has been provided for Linear Regression Analysis. Firstly, we need get the last 12 months (in the example below, we presume current month is Sep, 2007) which will be shown on the x-axis on a chart. Then, we need get the rank of the monthes which represents the value on the x-axis. Next, we need call the LinRegPoint function to calculate the value of the y-intercept in the regression line.
WITH
//presume current month as Sep, 2007 as demo
SET [Last 12 Months] AS
{[Date].[Calendar].[Month].&[2007]&[9].LAG(12):[Date].[Calendar].[Month].&[2007]&[9]}

MEMBER [Measures].[Month Rank] AS
RANK(
[Date].[Calendar].CURRENTMEMBER
, ORDER ([Last 12 Months], [Date].[Calendar].CURRENTMEMBER.properties("key"), BASC)
)

MEMBER [Measures].[Liner Regression Trend Point] AS
LinRegPoint([Measures].[Month Rank]
,[Last 12 Months]
,[Measures].[Sales Amount]
,[Measures].[Month Rank])
,FORMAT_STRING = "Currency"

MEMBER [Measures].[MonthValue] AS
[Date].[Calendar].CURRENTMEMBER.membervalue

Select {[Measures].[MonthValue],[Measures].[Sales Amount]
,[Measures].[Liner Regression Trend Point]} on columns,
[Last 12 Months] on rows

from [Adventure Works]
