Category: Data Quality / dqops

dqops Data Quality Rules (Part 2) – CFD, Machine Learning

dqops Data Quality Rules (Part 2) – CFD, Machine Learning

The previous blog post introduces a list of basic data quality rules that have been developed for my R&D data quality improvement initiative. Those rules are fundamental and essential for detecting data quality problems. However, those rules have existed since a long, long time ago and they are neither innovative nor exciting. More importantly, those rules are only capable to detect the Type I, “syntax” data quality problems but are not able to find the Type II, “semantic” data quality problems.

Type II “Semantic” Data Quality Problems

Data quality rule is expected to be an effective tool for automating the process of detecting and assessing data quality issues, especially for a large dataset that is labour-intensive to do manually. The basic rules introduced in the previous blog post are effective to detect the Type I problems that require “know what” knowledge of the data, such as the problems falling in the completeness, consistency, uniqueness and validity data quality dimensions.

Type II data quality problems are those “semantic” problems that require “know-how” domain knowledge and experience to detect and solve. This type of problem is more enigmatic. The data looks all fine on the surface and serves well most of the time. However, the damage caused by them to businesses can be much bigger.

Martin Doyle’s 80:20 rule states around 80% of data quality problems are Type I problems and only 20% of data quality problems are Type II problems. However, the Type II problems cost 80% of effort and budget to solve while the Type I problems only takes 20% of effort and budget.  

Under the pressure of limited project time and budgets, plus that the type II data quality problems are normally less obvious than the Type I problems, Type II data quality problems are often overlooked and keep unnoticeable until damages are made to the business by the bad data. The later the problems are found, the severe the damages could be. Based on the 1:10:100 rule initially developed by George Labovitz and Yu Sang Chang in 1992, the costs of solving quality problems increase exponentially over time. When it might only cost you $1 to detect and solve data quality problems at the early stage, the costs of failure caused by hidden data quality problems could be $100 or more.

Therefore, it is important to detect and solve Type II problems before they have made damage to the business. Unfortunately, the job of solving Type II data quality problems is not easy that requires domain experts to invest a significant amount of time to study the data, identify patterns and locate the issues. This could become mission impossible when the data volume is getting larger and larger. Not only the current manual approach is expensive and time-consuming but also it is highly dependant on the domain experts’ knowledge and experiences in the business processes, including the “devils in the details” type of knowledge that only exists in those domain experts’ heads.

So, can we find an alternative approach to solve the Type II problems without the dependency on the domain experts’ knowledge and experiences? can we identify the patterns and relations existing in a dataset automatically with the help of the computation power from modern computers to exhaustively scan through all possibilities? The Machine Learning and Data Mining techniques might provide an answer.

Based on my literature review, a number of ML/DM techniques are promising for handling Type II data quality problems. In my dqops R&D project, I have been experimenting with those techniques and exploring the potential ways to adapt them in a software app for non-technical DQ analysts. In the rest of the blog post, I am going to describe the ways I have been exploring in my toy dqops app, focusing on Conditional Functional Dependency and self-service supervised machine learning, with a brief introduction of anomaly detection and PII detection features.

Conditional Functional Dependency (CFD)

CFD, originally discovered by professor Wenfei Fan from the University of Edinburg, is an extension to traditional functional dependencies (FD). FD is a class of constraints where the values of a set of columns X determine the values of another set of columns Y that can be represented as X → Y. CFD extends the FD by incorporating bindings of semantically related values that is capable to express the semantics of data attribute dependencies. CFD is one of the most promising constraints to detect and repair inconsistencies in a dataset. The use of CFD allows to automatically identify context-dependent quality rules. Please refer to my previous blog post for a detailed explanation of CFD

CFD has demonstrated its potentials for commercial adoption in the real world. However, to use it commercially, effective and efficient methods for discovering the CFDs in a dataset are required. Even for a relatively small dataset, the workload to manually identify and validate all the CFDs is overwhelming. Therefore, the CFD discovery process has to be automated. A number of CFD discovery algorithms have been developed since the concept of CFD was introduced. In my dqops app, I have implemented the discovery algorithm from Chiang & Miller in Python. Please refer to the paper on this algorithm from Chiang & Miller for details.

The snapshot below shows the dependencies discovered from Kaggle Adult Income dataset.

Based on the discovered dependencies, DQ analysts can create DQ rules to detect any data row that does not comply with the dependency. In dqops DQ studio, there are two rule templates that can be used to define the dependency constraint, the “Business Logics” rule and the “Custom SQL” rule. The snapshot below shows the definition panel of the “Business Logics” rule.

Self-serivce Supervised Machine Learning

One traditional but effective method for detecting data quality problems is to use “Golden Dataset” as a reference and search for records that conflict with the pattern presented in the “Golden Dataset”. This method is feasible for a “narrow” dataset with a manageable number of columns/attributes. However, for a dataset with a large number of attributes for each record, it becomes impossible to manually identify the patterns in the dataset. Fortunately, this happens to be what Machine Learning is good at.

In my dqops R&D project, I have been exploring the potential approaches to take advantage of Machine Learning techniques to identify Type II data quality problems. There are two prerequisites required for this idea to work:

  • A “Golden Dataset”
  • A self-service machine learning model builder

The main steps for this idea are:

  1. DQ analysts prepare the “Golden Dataset”
  2. DQ analysts train and verify a regression or classification model with the “Golden Dataset”
  3. DQ analysts apply the trained model to test target datasets

In the dqops app, I have developed a self-service machine learning model builder that allows DQ analysts without machine learning skills to train machine learning models by themselves. Under the hood, the auto-sklearn package is used for the model training.

I have been trying my best to make the self-service model builder as easy to use as possible. DQ analysts just need to upload the “Golden Dataset”, specify the target column (i.e. the dependent variable) and select the task type, regression or classification. Some advanced settings are also enabled for further tunning for advanced users.

Once submitted, the model will be trained backend. When the model is ready for use, DQ analysts can create an “ML Regression” rule on the datasets with the same schema of the “Golden Dataset”.

The execution of the rule load the model and predict the target column (dependent variable) and calculate the tolerant range of expected value. When a field value falls out of the expected value range, that value is treated as inconsistent.

The decisive factor for this idea to work is the accuracy of the models trained by the self-service builder. Auto-sklearn is able to choose the most performant algorithms and the most optimal hyperparameters based on the cross-validation results automatically. Therefore, the quality of the “Golden Dataset” decides whether the trained model would work or not.

Anomaly Detection

Anomaly detection is a popular use case for commercial AI-enabled data quality monitoring software. It logs the history of data quality observations and detects the anomaly. Anomaly detection is an effective technique to raise awareness of data quality issues. I have also implemented an anomaly detection feature in the dqops app. The approach I have been using is to conduct a time-series analysis of the historical observations using fbprophet package and check whether or not the current observation is in the predicted value range.

PII Detection

Strictly speaking, data privacy is a regulation issue instead of a data quality issue. However, PII handling is often put into the data quality assurance process and treated as a data clean task. In dqops app, I created a PII detection rule that can be applied to a text column and detect any person name. The implementation of PII detection rule is rather simple with SpaCy package.

dqops Data Quality Rules (Part 1) – Basic Rules

In my previous blog post, I discussed the requirements and core elements of the rule-based data quality assessments. In this and next blog posts, I am going to walk through the data quality rules designed in the dqops DQ Studio app (one of my R&D initiatives for data quality improvement), ranging from the basic data quality rules for Type 1 (syntactic) data quality issues to the CFD, Machine Learning powered data quality rules for Type 2 (schematic) data quality issues.

This blog post covers the basic data quality rules for Type 1 data quality issues, including the rules for assessing validity, completeness, accuracy, uniqueness, timeliness and integrity.

Validity

At the time when this blog post is written, four DQ rule templates have been developed in dqops DQ Studio for assessing the validity of a data field:

  • Regex Constraint Rule
  • Range Constraint Rule
  • Length Constraint Rule
  • Domain Constraint Rule

Regex Constraint Rule

Regex Constraint rule allows the DQ analysts to specify the regular expressions of the valid formats a column has to comply with. This rule scans the column to count the values with the valid formats complying with the specified regular expressions and divide by the count of total rows to calculate the validity metric value.

metric = count({values matching regex}) / total rows

The DQ analysts can select one or more regular expressions from pre-defined, commonly used formats for a column, or define custom regular expressions.

When the rule is being executed, the column associated with this rule is scanned to look up the field values that comply with the specified regular expressions. The result is then logged into a backend database and the rows with invalid values are logged into a low-costs, object-based storage account to keep a full history for the data quality trend analysis and issue investigations.


Range Constraint Rule

Range Constraint rule allows the DQ analysts to specify a valid range of a numerical or date type column. This rule scans the target column to detect the values falling outside of specified range.

metric = 1- count({values out of valid range})/total rows

Range Constraint rule detects the data type of the column and generate input controls for DQ analysts to specify the the minimum and maximum numerical values (for numerical column type) or dates (for date column type)

Length Constraint Rule

Similar with the Range Constraint rule, the Length Constraint rule allows DQ analysts to specify the valid length range of a column and detect any field value that falls out of the range, for example, a Length Constraint rule can be used to check the validity of a bank card number column with valid length to be 16 digits.

metric = 1 - count({values out of valid range}) / total rows

Domain Constraint Rule

Domain Constraint rule allows DQ analysts to pre-define a list of valid domain values or “Golden Records” of an entity attribute, such as “Product Code” and “Cost Center Code”. Any field value that is not on the pre-defined list is invalid.

At the time when this blog post is written, DQ analysts can upload and centerally manage the pre-defined domain values (in csv file format) in the dqops DQ studio.

Once the pre-defined domain value csv file is uploaded, DQ analysts can apply the Domain Constraint rule to a column and specify the domain values.

Completeness

Completeness rule scans a column to evaluate the scale of missing values. When the scale of incompleteness of a column reaches to a level, the column can be not usable, especially for LOB datasets with transactional data, missing data implies potential business or IT exceptions or errors.

The missing values refer to not only the syntactic empty or null data type value but also possibly the default values, such as “Not Appliable”, “Default”, 0, 1970-01-01. The default values are either set by client application automatically when a field on the input UI is not filled or users just pick a default value to fill a compulsory form field.

Completeness rule counts the missing values and divide it by the total rows in the dataset and substract the result from 1 to calculate the completeness metric.

metric = 1 - count({missing or default}) / total rows
Accurary

I borrowed the ideas from Apache Griffin for assessing accuracy of a dataset, i.e. comparing the target dataset to a reference dataset that can be treated as reflecting “real world” truth. DQ analysts can create connections to the reference dataset and select columns and aggregate functions to define the comparison rules.

This “Source vs Target” rule can also be used for data reconciliation in a ETL process to validate the target dataset is same with the source dataset.

Uniqueness

Uniqueness rule scan a column to detect the duplicated values.

metrics = count(distinct values) / total rows
Timeliness

Timeliness rule exams the last modified date of each entity in the dataset to detect the entities that are older than the specified period.

metric = count(entities [last updated < (Today - late_allowed)]) / total entities

Referential Integrity

Referential Integrity rule scan a column to detect the invalid reference values.

metric = 1 - count(invalid values) / total rows
Data Quality Improvement – Rule-Based Data Quality Assessment

Data Quality Improvement – Rule-Based Data Quality Assessment

As discussed in the previous blog posts in my Data Quality Improvement series, the key for successful data quality management is the continuous awareness and insights of how fit your data is being used for your business. Data quality assessment is the core and possibly the most challenging activity in the data quality management process. This blog post discusses the requirements and core elements of rule-based data quality assessments.

Requirements of Data Quality Assessments

What do we want from data quality assessments? In short, we want the data quality assessments to tell us the level of fitness of our data for supporting our business requirements. This statement implies two core requirements of data quality assessments:

  • Data quality assessments need to evaluate the quality of data in a business context. Quality is an abstract and multifaceted concept. The criteria to decide the data quality is based on what is the business required for good data.
  • Data quality assessments need to be able to evaluate the level of data fitness. As mentioned above, continuous monitoring is the key to successful data quality management. We need a tool to understand the trend and degree of the data quality evolving.
Rule-Based Data Quality Assessments

For those two requirements of data quality assessments mentioned above, let’s have a think about what we will need in order to fulfil those requirements.

Firstly, to evaluate the fitness of a set of data to a business requirement, we first need to know the criteria the business is using to evaluate whether or not the data is fit to use. A simple and good representation of the business-oriented criteria is a set of constraint-based rules. The fitness can be decided by checking whether or not the constraints are complied. The constraint-based rules not only simplify the representation and organisation of facets of data quality but also acts as an effective common language between the persona involved in the data quality management process.

Secondly, we need an effective representation of the level of data fitness. This representation needs to be able to describe the degree of the data quality changes and also the distances to the different data quality status (e.g., good, ok, bad, very bad) expected by the business. Yes, nothing is better than a numerical value that is normally referred to as a DQ metric. DQ metrics are widely used and studied in both commercial and research communities and they are often interpreted from different angles. Below is my definition of DQ metrics:

  • It represents the quality of a specific attribute of a set of data
  • It is a numerical number in a fixed range (e.g. 0..1 or 0..100)
  • It can represent data quality at a different level

As mentioned before, I personally consider data quality assessment as the most challenging activity in the data quality management process. At the same time, I think defining DQ metrics is the most challenging activity in the data quality assessment process. To ensure the DQ metrics you defined accurately representing the data quality, not only do you need to find a good formula for calculating the metrics, but also you need to take all sorts of business factors into consideration, such as business impacts, urgencies, and criticalities.

Figure 1. Pre-defined DQ Rules in dqops DQ studio
Elements of Data Quality Rules

In the rest of this blog post, I am going to explore the core elements of data quality rules and how they could be defined to support data quality assessments. The dqops DQ studio (the app I have been building for one of my personal R&D initiatives) will be used as examples for discussing those elements of DQ rules.

A data quality rule needs to contain the following five core elements:

  • Business Constraints
  • Metric Formula
  • Alert Thresholds
  • DQ Dimension
  • Metric Aggregation Algorithm

Business constraints specify the conditions for a set of data to qualify to be fit to use in a business scenario. Let’s take the Regular Expression constraint rule in the dqops DQ Studio as an example (as shown in the snapshot below). This rule is used to evaluate whether a column value in a dataset complies with a format specified by a regular expression. For example, a column that stores France postcodes is fit to use only when its values comply with the specified France postcode format.

Figure 2. Regular Expressions Constraint Rule in dqops DQ Studio

DQ metrics are the numerical representations of an aspect of the quality of a dataset. The Metric formula defines the calculation to determine the number. In the Regular Expression constraint rule example, the metric could be defined as the count of column values that comply with the regex divided by the count of rows in the dataset.

In the example above, the result calculated from the metric formula is a number between 0 to 1 or in the format of 0% to 100%. However, a number alone cannot tell whether the set of data is fit or not in the given business context. Alert Threshold is the tool to make the cut. In the Regular Expression constraint rule example, as the snapshot above shown, a warning threshold could be set as 90% while a critical threshold could be set as 70%. That means the quality of the data set (for the format validity aspect defined in regular expressions) is ‘Good’ when the metric number is over 90% and is ‘OK’ when it is between 70% and 90% and is not fit when the number is under 70%. Alert thresholds can be manually defined based on the business/DQ analysts experiences or be automatically defined based on the historic distribution of the observed values.

Figure 3. DQ Monitoring Panel in dqops DQ studio

Another element of a DQ rule is the Dimension that the DQ rule is evaluating into. As I mentioned in my previous blog post, I have a rather mixed feeling about DQ dimension. On one hand, DQ dimensions are context-dependent that could be interpreted differently in a different context by different people. On the other hand, DQ dimensions create a common language to express and classify the quality of data when quality itself is an abstract concept that could represent many aspects. To solve this dilemma, as I suggested before, instead of pursuing a global consensus on the universal DQ dimensions in any context indifferently, the DQ dimensions need to be defined and interpreted based on the expected purposes of the data and the consensus on the DQ dimension meanings need to be made in an internal, domain-specific environment. In the dqops DQ Studio, the dimension of a DQ rule is not pre-defined, but instead, business/DQ analysts are allowed to specify dimension for a DQ rule based on their interpretations of the dimension in their organisation.

The last but not least element of a DQ rule is the Metric Aggregation Algorithm. Data quality needs to be assessed and analysed at different granularity levels, such as column-level, dataset-level, database-level, domain-level, up to organisation-level. To represent the data quality using metrics at different levels, the low-level metrics need to be aggregated into the higher level. The algorithm for aggregating the metrics needs to take the business impacts as weighted variables, such as severity level and priority level of DQ issues.

Figure 4. DQ Dashboard in dqops DQ Studio

What is Data Management, actually? – DAMA-DMBOK Framework

What is Data Management, actually? – DAMA-DMBOK Framework

“What is data management?”. I guess many people will (at least I think I will) answer “em… data management is managing data, right?” at the same time swearing in their heads that “what a stupid question!”.

However, if I was asked this question in a job interview, I guess I’d better to provide a bit longer answer, such as the one given by DAMA cited below if I could ever memorise it.

Data Management is the development, execution, and supervision of plans, policies, programs, and practices that deliver, control, protect, and enhance the value of data and information assets throughout their lifecycles.

DAMA-DMBOK

If the interviewers asked me to elaborate in further detail, it could be a challenge as there are so many facets and aspects of Data Management. Many interdependent functions with their own goals, activities, and responsibilities are required in data management. For a data management professional, it is difficult to keep track of all those components and activities involved in data management.

Fortunately, DAMA developed the DMBOK framework, organising data knowledge areas in a structured form, that enables data professionals to understand data management comprehensively.

I have recently been diving into the heavy reading DAMA DMBOK book (“heavy” is in its literal manner, the book weighs 1.65kg!). I actually recommend all data professionals to give a read of this book. It is not only able to connect the dots in your knowledge network to have a comprehensive understanding of data management but also to provide a common language enabling you to communicate in the data world (instead of just nodding and smiling in a meeting when hearing some data jargon.

DAMA DMBOK framework defines 11 functional areas of data management.

As you can see from the DAMA Wheel above, Data Governance is at the heart of all the data management functional areas. Data governance provides direction and oversight for data management to ensure the secure, effective, and efficient use of data within the organisation. The other functional areas include:

  • Data Architecture – defines the structure of an organisation’s logical and physical data assets and data management processes through the data lifecycle
  • Data Modelling and Design – the process of discovering, analysing, representing and communicating data requirements in the form of data model
  • Data Storage and Operation – the process of designing, implementing, and supporting data storage
  • Date Security – ensuring data is accessed and used properly with data privacy and confidentiality are maintained
  • Data Integration and Interoperability – the process of designing and implementing data movement and consolidation within and between data sources
  • Document and Content Management – the process of managing data stored in unstructured medias
  • Reference and Master Data – the process of maintaining the core critical shared data within the organisation
  • Data Warehousing and Business Intelligence – the process of planning, implementing and controlling the processes for managing the decision supporting data
  • Metadata – managing the information of the data in the organisation
  • Data Quality – the process of ensuring data to be fit to use.

Based on the functional areas defined by the DAMA Wheel, Peter Aiken developed the DMBOK pyramid that defines the relation between those functional areas.

From the DMBOK pyramid, we can see the top of the pyramid is the golden function that is the most value-added for the business. However, the DMBOK pyramid reveals that the data analytics is just a very small part in an organisation’s data system. To make the data analytics workable, a lot of other functions need to work and collaborate seamlessly to build the foundation.

As the DMBOK pyramid shows, data governance is at the bottom that makes the ground foundation for the whole data system. Data architecture, data quality and metadata make up another layer of logical foundation on top of the data governance. The next level of upper layer includes data security, data modelling & design, and data storage & operations. Based on that layer, data integration & interoperability function can work on moving and consolidating data for enabling the functions at the upper layer, data warehousing/business intelligence, reference & master data, and documents & contents. From this layer, the functions start to be business faced. That also means the business cannot see the functions that need to run underneath.

The practical contribution from DMBOK pyramid is to reveal the logical progression of steps for constructing a data system. The DMBOK pyramid defines four phases for an organisation’s data management journey:

Phase 1 (Blue layer) – An organisation’s data management journey starts from purchasing applications that include database capabilities. That means the data modelling & design, data storage, and data security are the functions to be in place at first.

Phase 2 (Orange layer) – The organisation starts to feel the pains from bad data quality. To improve data quality, reliable metadata and consistent data architecture are essential.

Phase 3 (Green layer) – Along with the developments of the data quality, metadata and data architecture, the needs of structural supports for data management activities starts to appear that reveals the importance of a proper data governance practice. At the same time, data governance enables the execution of strategic initiatives, such as data warehousing, document management, and master data management.

Phase 4 (Red layer) – well-managed data enables advanced analytics.

The four phases of DMBOK seem to make sense, however, from my own experiences, organisations often go on different routes, mostly starting to rush on high-profiling initiatives such as data warehousing, BI, machine learning when no data governance, data quality, metadata etc. is in place.

Data Quality Improvement – DQ Dimensions = Confusions

Data Quality Improvement – DQ Dimensions = Confusions

DQ Dimensions are Confusing

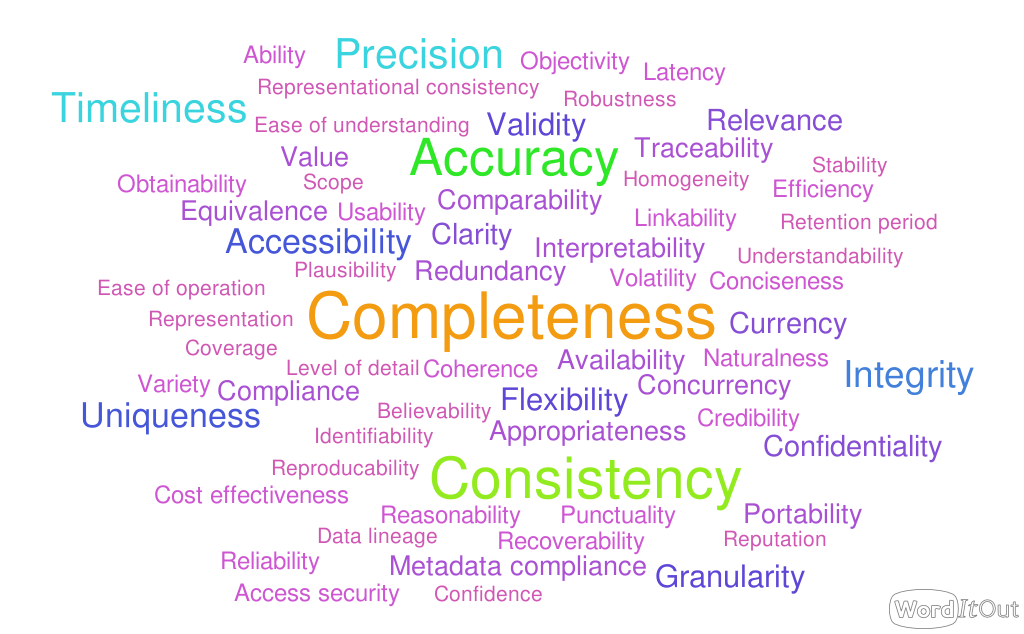
Data quality dimensions are great inventions from our data quality thought leaders and experts. Since the concept of quality dimensions was originally proposed in the course of the Total Data Quality Management (TDQM) program of MIT in the 1980s [5], a large number of data quality dimensions have been defined by people from different backgrounds and industries. A survey conducted by DAMA NL in 2020 identifies 127 data quality dimensions from 9 authoritative sources. The DQ dimension word cloud created by MIOSoft [7] has perfectly demonstrated the scale of DQ dimensions.

Figure 1. DQ Dimension Word Cloud from MIOSoft [7]

It might not be that bad to have that many dimensions if they are clearly defined and universally agreed upon. Unfortunately, DQ dimensions are not based on concrete concepts and are not the fundamental property of the data [7]. Instead, they are context-dependent. The same DQ dimension can be interpreted differently in a different context by different people.

The Effort from DAMA UK

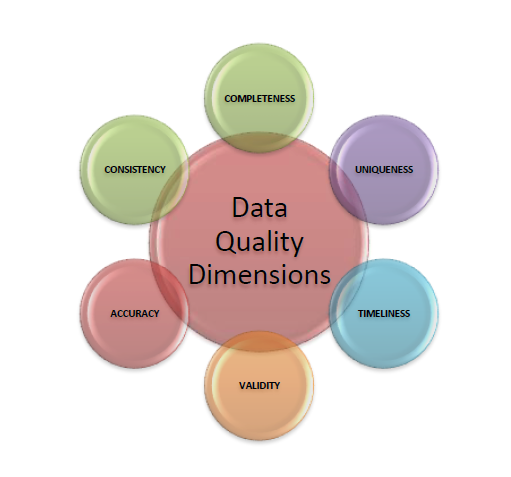
In 2013, DAMA UK organised a working group of data quality experts aiming to tackle the inconsistent understandings and interpretations of DQ dimensions and to define a set of core DQ dimensions that is the industry standard and well accepted by data professionals. Six core DQ dimensions have been defined by the group, including Completeness, Uniqueness, Consistency, Accuracy, Validity and Timeliness.

Figure 2. DAMA UK Data Quality Dimensions

To a certain extent, these six core DQ dimensions have indeed become the industry standard and well accepted in the data quality community: they have been used in the mainstream commercial data quality software (despite some of them tweaked one or two dimensions, e.g. replace timeliness with integrity); they have been widely referenced in the academic research community; they have been used as the standard dimension definitions in the government data quality guide, e.g. the UK Government Data Quality Framework published in 2020.

Confusion Continues

However, despite the six core DQ dimensions have been well known and accepted, confusion still exists. For example, the “Accuracy” dimension, arguably the most important data quality dimension [5], is defined as “The degree to which data correctly describes the ‘real world’ object or event being described”. However, how to measure “Accuracy” in practice? The reality is a gold standard dataset that can be used to refer to the ‘real world’ object is not available in most of the scenarios. In a survey of data quality measurement and monitoring tools conducted in 2019 [5], only one tool, Apache Griffin, was found to support the the “Accuracy” dimension despite it actually does not strictly follow the definition of “Accuracy” (It compares a target dataset to a source dataset without the validation of the source dataset reflecting the real world objects). The same situation happens to “Timeliness” dimension as well. According to DAMA UK’s definition, “Timeliness” is “the degree to which data represent reality from the required point in time”. Again, the reference to the time the real world event happens is not available in most real world scenarios. Instead, the time available in a database that represents the event is often the time when the event record is created or modified in the database.

Despite the DQ dimensions have been frequently referenced by the data quality software vendors in their website or sale materials, A study conducted by Ehrlinger, Rusz and Wöß [5] found that few DQ metrics have been actually implemented to measure the DQ dimensions. As figure 3 shown, amongst the popular commercial and open-source DQ software, only Apache Griffin implements metrics to measure “Accuracy” (for a certain extent, as mentioned above). No software supports “Consistency” and “Timeliness” dimensions. There is no widespread agreement in the implementation and definition of DQ dimensions in practice. When Ehrlinger, Rusz and Wöß [5] contacted the vendors for further details of the dimensions and metrics in their software, few vendors provided a satisfying reply of how the dimensions are measured.

Figure 3. DQ Dimensions Implemented in Commercial and Open-Source DQ software

However, it is possibly not fair to blame DQ software vendors for the confusion with DQ dimension measurements. DQ dimension itself is not a concrete concept but instead is context-dependent. It may be relatively simple to define dimensions and metrics to measure them for a specific business domain. However, those dimensions and metrics have little practical relevance for other business domains. Therefore, the question may not be how to create a set of universal dimensions and metrics that can be used by a general-purpose DQ software to fit all the scenarios, but instead, the question may be whether or not we should pursue a universal dimension at the first place.

What Can We Do?

As it is not practical to define universal dimensions and metrics and to use them in a general-purpose DQ software, shall we bother to use the concept of dimension in data quality assessments at all? According to Ehrlinger, Rusz and Wöß [5], several DQ tools have shown the capabilities to measure data quality without referring to the dimensions at all, and they suggest that a practical approach is required without the need for DQ dimensions but instead focusing on the measurements of core aspects such as missing data and duplicate detection that can be automated.

However, I think DQ dimension is a great invention! It creates a common language to express and classify the quality of data. Quality itself is an abstract concept that represents many aspects. That makes it difficult to communicate between people. DQ dimensions provide an efficient way to have comprehensive and organised descriptions of data quality.

The confusions are not caused by DQ dimension itself, but instead the problem is that the DQ dimensions are interpreted differently in a different context, for a different business domain, and by people from different backgrounds. Due to the context-dependent nature of data quality assessments, it is not realistic to have a set of dimensions with universal definition/interpterion and uniformly metrics to measure them.

Instead of pursuing a global consensus on the universal DQ dimensions and using them globally as the common language for describing data quality in any context, the DQ dimensions need to be interpreted based on the expected purposes of the data and the consensus on the DQ dimension meanings only need to be made in an internal, domain-specific environment. In other words, the DQ dimensions only need to be defined as the common language within the group of people who are relevant to the data, such as the producers, consumers and governors of the data. As long as the consensus on the meaning of the DQ dimensions is reached within the group, the DQ dimensions are effective.

References

[1] C. Batini, M. Scannapieco, Data and Information Quality: Concepts, Methodologies and Techniques. Springer International Publishing, Switzerland, 2016.

[2] A. Black, P. van Nederpelt, Dimensions of Data Quality (DDQ) Research Paper, DAMA NL Foundation, 3 September 2020.

[3] DAMA UK, The Six Primary Dimensions for Data Quality Assessment, 2013

[4] I. Diamond, A. Chisholm, The Government Data Quality Framework, https://www.gov.uk/government/publications/the-government-data-quality-framework/the-government-data-quality-framework, 2020

[5] L. Ehrlinger, E. Rusz, & W. Wöß, A Survey of Data Quality Measurement and Monitoring Tools, 2019, ArXiv, abs/1907.08138.

[6] B. Heinrich, M. Kaiser, and M. Klier, How to Measure Data Quality? A Metric-based Approach. In S. Rivard and J. Webster, editors, Proceedings of the 28th International Conference on Information Systems (ICIS), pages 1–15, Montreal, Canada, 2007. Association for Information Systems 2007.

[7] MIOSoft, Data Quality Dimensions Untangled, https://miosoft.com/resources/articles/data-quality-dimensions-untangled.html

[8] L. Sebastian-Coleman, Measuring Data Quality for Ongoing Improvement: A Data Quality Assessment
Framework. Elsevier, Waltham, MA, USA, 2012.

Data Quality Improvement – Conditional Functional Dependency (CFD)

Data Quality Improvement – Conditional Functional Dependency (CFD)

To fulfil the promise I made before, I dedicate this blog post to cover the topic of Conditional Functional Dependency (CFD). The reason that I dedicate a whole blog post to this topic is that CFD is one of the most promising constraints to detect and repair inconsistencies in a dataset. The use of CFD allows to automatically identifying context-dependent quality rules. That makes it a promising tool for automatic data quality rule discovery. CFD was originally developed by professor Wenfei Fan from the University of Edinburg. I have listed some of his papers regarding CFD [1][4][5] in the reference section at the end of this post.

Conditional Functional Dependency (CFD)

CFD is an extension to traditional functional dependencies (FD). FD is a class of constraints where the values of a set of columns X determine the values of another set of columns Y that can be represented as X → Y. FD that was developed mainly for schema design [1] is required to hold on entire relation(s) that makes it less useful for detecting data inconsistencies for the real-world datasets. CFD extends the FD by incorporating bindings of semantically related values that is capable to express the semantics of data fundamental to data cleaning [1].

Here I will borrow the classic ‘cust’ relation example from [1] that I found is possibly the simplest way to explain the CFD concept. Figure 1 shows an instance r0 of ‘cust’ relation that specifies a customer in terms of the customer’s phone (country code (CC), area code (AC), phone number (PN)), name (NM), and address (street (STR), city (CT), zip code (ZIP)).

Figure 1. An instance of the cust relation
Traditional Functional Dependency (FD)

From the customer records shown in Figure 1, we can see that all the customers with the same country code (CC) and area code (AC) are located in the same city (CT) as well. For example, all customers with CC as ’01’ and AC as ‘908’ are located in the CT ‘MH’ (t1, t2, and t4). Here we have the functional dependency, f1: [CC, AC ] → [CT ], that the CC and the AC can determine the value of CT. As this dependency applies to the entire relation, this is a traditional functional dependency. In addition, we can find another traditional functional dependency in the relation, f2: [CC, AC, PN ] → [STR, CT, ZIP ], that represents the dependency that phone country code, area code and number can determine the street name, city, and zip code.

Conditional Functional Dependency (CFD)

Let’s take a look at another example, f: [ZIP] → [STR]. For the customers (t5 and t6) with the same ZIP code ‘EH4 1DT’, they do have the same STR value ‘High St.’. Now let’s check the dependency on the entire relation for all customers. We can see that the dependency applies to t1 and t2 with ZIP as ‘07974’ and STR as ‘Tree Ave.’. However, this dependency does not apply to t4 that has ZIP as ‘07974’ but STR as ‘Elm Str.’. In this case, the ZIP code ‘07974’ cannot determine a unique STR value. Therefore, the constraint [ZIP] → [STR] does not hold on the entire relation so it is not a functional dependency. However, the constraint [ZIP] → [STR] does hold on for the customers with country code (CC) as ’44’, i.e. a UK address. In other words, the postcode can determine street in the UK address system but not in the US address system, and the constraint [ZIP] → [STR] only hold on when the country code is 44. This type of constraints is conditional functional dependency (CFD) that can be notated as ([CC, ZIP] → STR, (44, _ || _ )) where [CC, ZIP] → STR refers to the functional dependency and (44, _ || _ ) specifies the condition, i.e. when CC is 44, ZIP uniquely determines STR. The notation of a CFD can be generalised as (X → A, tp) where X → A is an FD and tp is a tuple pattern specifying the attributes in X and A that defines the subset where the FD holds on.

Constant Conditional Functional Dependency (CCFD)

As mentioned above, a CFD can be expressed as (X → A, tp) where tp is a tuple pattern, such as the example mentioned earlier (44, _ || _ ) where the symbol ‘||’ separate the left-hand side (LHS) from the right-hand side (RHS) of the dependency and the symbol ‘_’ represents any possible value, i.e. ‘_’ is a variable in the language of programming. One special case of CFD is that all the attributes for defining the tuple pattern are constants. For example, for the CDF, ([CC, AC] → CT, (01, 908 MH)), all the attributes defining the tuple pattern are constants: CC=01; AC=908; CT=MH. In plain English, the phone country code 01 and phone area code 908 of a customer determine the city where this customer is located to be MH. Compared to normal CFD, CCFD attracts more attention from the data quality community as CCFD expresses the semantics at the most detailed level and is easy to be used to check data consistencies.

CFD Discovery

Compared to FD, CFD is more effective in detecting and repairing inconsistencies of data [2][3]. CFD has demonstrated its potentials for commercial adoption in the real world. However, to use it commercially, effective and efficient methods for discovering the CFDs in a dataset are required. Even for a relatively small dataset, the workload to manually identify and validate all the CFDs is overwhelming. Therefore, the CFD discovery process has to be automated. A number of CFD discovery algorithms [2][5][6] have been developed since the concept of CFD was introduced.

In this section, I will introduce the CFD discovery algorithm developed by Chiang & Miller [2]. This method has been proved by Chiang & Miller [2] as effective to capture semantic data quality rules to enforce a broad range of domain constraints. In addition, as the redundant candidates are pruned as early as possible, the search space for the set of minimal CDFs is reduced as well as the computation time for discovering the CDFs.

Chiang & Miller have used 12 double-column pages in their paper [2] to elaborate their algorithm. That paper is informative and worth reading in detail if you are interested at data quality rule discovery. In the rest of this blog post, I will try my best to use simple language to explain how this algorithm works.

Firstly, let’s assume we have a relation with four attributes, A, B, C, D. We want to find the CFDs in the relation. The result set of CFDs needs to be minimum with redundant CFDs disregarded. In addition, we expect the algorithm takes as little computation time as possible. From the four attributes, A, B, C, D in the relation, the search space for the CFDs can be illustrated in an attribute search lattice (Figure 2). Each node in the lattice represents an attribute set. For example, ‘AC’ represents an attribute set including attribute ‘A’ and attribute ‘C’. The single-direction edge between two nodes represents a candidate CFD. For example, the edge (AC, ABC) represents ([A, C] → B, (x, x || x)) and the pattern tuples are unknown and needs to be mined out by the algorithm.

Figure 2: Attribute search lattice

The candidate CDFs are evaluated by traversing the lattice using a breadth-first search (BFS) algorithm, i.e. starting at the tree root and traversing all nodes at the present depth level before moving to the next depth level. In our example, we first traverse through the first level (k =1) that consists of single attribute sets (i.e. [A], [B], [C], [D]), followed by the second level (k = 2) that consists of 2-attribute sets (i.e. [A, B], [A, C], [A, D], [B, C], [B, D], [C, D]), and the next level until level k = total levels -1 or all CDFs in a minimum set have been found.

To achieve optimised algorithm efficiency, not all nodes in the lattice are visited. Instead, this algorithm prunes nodes that are supersets of already discovered rules and nodes that do not satisfy the threshold. In this way, the search space is reduced by skipping the evaluations of descendant nodes. For example, when the candidate ([A, C] → B, (A=’x’, _ || _)) is found to be a CDF, then it is no point to evaluate the candidate ([A, C, D] → B, (A=’x’, _, _ || _)) as the CDF ([A, C] → B, (A=’x’, _ || _)) already covers the semantics of ([A, C, D] → B, (A=’x’, _, _ || _)).

To evaluate whether or not a candidate in the lattice is a valid CDF, we can identify the values of left-hand side (LHS) of the candidate and check whether the same values of left-hand side (LHS) maps to the same value of right-hand side (RHS). To model this in the language of programming, we group the LHS attribute value set and RHS attribute value set, for a valid CDF, the tuples in the LHS group do not split into two or more RHS groups. Generally speaking, the more tuples fallen in a group that represents a valid CDF, this CDF is more preferable. A threshold can be imposed to the number of tuples a CDF need to hold on for it is qualified as a valid CDF.

For the tuple groups that fail the CDF validity test, they can still be refined by considering additional variable and conditional attributes.

Figure 3: A portion of the attribute search lattice

For example, as Figure 3 shown, we assume that no CFD can be materialised on a candidate [A, C] → B, of edge (AC, ABC). We can generate a new candidate in the next level of the lattice by considering an additional attribute such as D so that we have the new candidate as ([A, C, D] → B) as shown as an edge (X’, Y’) on Figure 3. If the new candidate is still not able to materialise to a valid CFD after adding a variable attribute, we can condition on an additional attribute. For example, we can condition on attribute D on top of an existing conditional attribute such as A. In Chiang & Miller’s algorithm, these new candidates are added into a global candidate list and the corresponding lattice edges are marked. The algorithm only searches the nodes with marked edges to ensure only minimal rules are returned.

References

[1] P. Bohannon, W. Fan, F. Geerts, X. Jia and A. Kementsietsidis, “Conditional Functional Dependencies for Data Cleaning,” 2007 IEEE 23rd International Conference on Data Engineering, 2007, pp. 746-755, doi: 10.1109/ICDE.2007.367920.

[2] F. Chiang, & R.J. Miller (2008). Discovering data quality rules. Proc. VLDB Endow., 1, 1166-1177.

[3] G. Cong, W. Fan, F. Geerts, X. Jia, and S. Ma, “Improving data quality: Consistency and accuracy,” in VLDB, 2007.

[4] W. Fan, F. Geerts, X. Jia, and A. Kementsietsidis, “Conditional functional dependencies for capturing data inconsistencies,” TODS, vol. 33, no. 2, June, 2008.

[5] W. Fan, F. Geerts, J. Li and M. Xiong, “Discovering Conditional Functional Dependencies” in IEEE Transactions on Knowledge and Data Engineering, vol. 23, no. 5, pp. 683-698, May 2011, doi: 10.1109/TKDE.2010.154.

[6] M. Li, H. Wang and J. Li, “Mining conditional functional dependency rules on big data,” in Big Data Mining and Analytics, vol. 3, no. 1, pp. 68-84, March 2020, doi: 10.26599/BDMA.2019.9020019.

[7] V.S. Santana, F.S. Lopes, (2019) Method for the Assessment of Semantic Accuracy Using Rules Identified by Conditional Functional Dependencies. In: Garoufallou E., Fallucchi F., William De Luca E. (eds) Metadata and Semantic Research. MTSR 2019. Communications in Computer and Information Science, vol 1057. Springer, Cham. https://doi.org/10.1007/978-3-030-36599-8_25