Tag: SSRS

Building SharePoint Solutions using SQL Server Reporting Services

Building SharePoint Solutions using SQL Server Reporting Services

There are many options available for building SharePoint-based applications. This blog post introduces another non-traditional option –
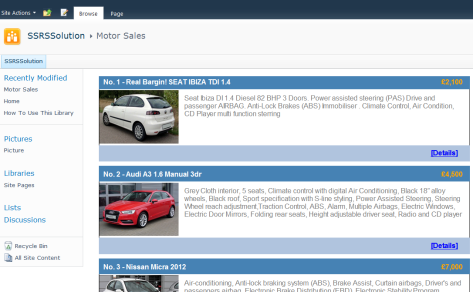
building SharePoint application using SQL Server Reporting Services. To introduce this approach, I will demo how to create a simplified second-hand car listing solution (within less than one hour):

S4

S5

Firstly, we go to a Sharepoint site and create a Sharepoint list to store the details of the cars. Then we open BIDS and create a report project. Within this project, we add a Sharepoint List data source and set it to connect to the Sharepoint site where the Cars list was created.

S1

Then, we need add a data set to retrieve data from the Sharepoint Cars list. We can use the query designer to build the query.

S2

The sharepoint CAML query is then generated and will be used to query Sharepoint list.

S3

After we have created the dataset, we had the fields ready for creating the report.

S6

We drag a table onto the report body and only keep one column, and then add a ‘Rectangle’ into the row cell and use the ‘Rectangle’ as the canvas to build the car listing item template.

S7

When users click the ‘Details’ link at bottom right corner on each car item, we expect the report to drill through to the car details report. Firstly, we add a new report (the car details report) into the BIDS project, and then create a parameter called ‘CarSaleID’ which will receive the item id passed through from the clicked car item.

S10

Then, we need create a dataset to get the car item from sharepoint list filtered by the given parameter. After we had the dataset ready, we can start to build the car item details template.

S8

After the car details report has been created, we go back to the car list report and create an Action on the ‘Details’ link which trigger the drill through to the details report with the car item id as the drill through parameter.

SP12

Now, we have had our reports created in BIDS and we need deploy to either report server (in Native mode) or SharePoint site (in Integrated mode). After the reports have been deployed, we could add Report Viewer Web Part to host the report on SharePoint page. The Report Viewer Web Part shipped with Integrated mode offers more features compared to the Report Viewer web part in Native mode. For example, we could connect filter web parts to Report Viewer Web Part (integrated version) to dynamically set the report parameters.

Creating PowerView Style Filters on SQL Server Reporting Services Reports

Creating PowerView Style Filters on SQL Server Reporting Services Reports

PowerView, the new commer of Microsoft reporting tools family, empowers report builders to create eye-catching reports with wow-factors in a rather simple way.

powerview_filter_01

One nice feature offered by PowerView is the image-based filter.

powerview_filter_02

Obviously, it would produce much better user experience compared to the drop down style filter in SSRS. Not only it looks much nicer, but also users don’t have to click the “View Report” button every time they changed their selections.

powerview_filter_04

It would give SSRS reports many wow-factors if we could add this PowerView style filters on SSRS reports. In this post, I will go through the steps to build up a PowerView style filter like the snapshot shown below.

powerview_filter_03

Firstly, we need have our report body ready with some charts or tables. As an example, I create a chart connecting to the sample Adventure Works cube and presenting the sale amounts of each product sub-category under a primary category which will be selected by end-users on our PowerView style filter. This is the query to fetch the data required by the chart.

SELECT
	NON EMPTY { [Measures].[Reseller Sales Amount]} ON COLUMNS,
	NON EMPTY { ([Product].[Product Categories].[Product].ALLMEMBERS ) } ON ROWS
FROM
	(SELECT
		STRTOSET(@ProductCategory, CONSTRAINED) ON COLUMNS
	FROM [Adventure Works])

As you can see above, a parameter (“@ProductCategory”) need to be passed into the query. We need define the parameter on report level and get the available values using the following query.

WITH
	MEMBER [Measures].[ParameterCaption] AS
		[Product].[Category].CurrentMember .MEMBER_CAPTION
	MEMBER [Measures].[ParameterValue] AS
		[Product].[Category].CurrentMember.UniqueName
	MEMBER [Measures].[ParameterLevel] AS
		[Product].[Category].CurrentMember .Level .Ordinal
SELECT
	{ [Measures].[ParameterCaption], [Measures].[ParameterValue], [Measures].[ParameterLevel] } ON COLUMNS,
	{[Product].[Product Categories].Children} ON ROWS
FROM [Adventure Works]

Then we add a horizontal list onto the table which is the host of the PowerView style filter (Creating horizontal list is out of scope of this post. Please just google it and tons of articles are there about this topic). On the item template, add an image placeholder and a textbox placeholder.

powerview_filter_06

We then need a dataset to get the product categories and also the image associated with each category. Unfortunately, there is no image information associating with primary category stored in the sample Adventure Works DW database. Therefore, I have added an Image column to the DimProductCategory table and assign a sample image for each category. The query below fetch the category name and image.

SELECT [ProductCategoryKey]
      ,[EnglishProductCategoryName]
      ,[Image]
FROM [dbo].[DimProductCategory]

After the product category image placeholder and name placeholder on the horizontal list are associated with the dataset. Right-click the image placeholder, go to properties and select the Action panel. Create a “Go to Report” type action and select the current report as the destination report.

powerview_filter_07

On the parameter section, select the ProductCategory parameter and set the value as:

 powerview_filter_08

After that, we have our PowerView style filter on the SSRS report.

powerview_filter_03


Creating Custom SSRS Spatial Map Reports for Dynamics CRM 2011

Creating Custom SSRS Spatial Map Reports for Dynamics CRM 2011

A CRM system in an organisation is often the central place to store business data related to customers, sales, and markets, which are highly valuable for any business. The BI feature in Dynamics CRM 2011 is very powerful which allows developers or even end-users to create report tables or charts very easily. However,  it is better to visualise some types of business data against a geographical background, e.g, customers geographical distribution or sales geographical distribution.

This blog post goes through the steps to create a spatial map report (customers geographical distribution in UK) using SSRS for Dynamics CRM 2011. Please find the sample report from my Codeplex site.

image

image

  1. Create a SSRS project in BIDS, and add a report.

  2. Create a Data Source connecting to the Dynamics CRM organisation database, and create a Data Set to query the customer lists (in this example, I used Account entity) from the CRM database.

  3. Convert UK postcode (stored as customer’s attribute in Account entity) to spatial data format type (latitude and longitude). Although the Account entity has fields to store latitude and longitude values of an address, few of users would actually input latitude/longitude into MSCRM. Instead, most of users prefer to store postcode in MSCRM to record the location of an account. However, the spatial data type supported by SQL Server 2008 R2 is converted from latitude/longitude instead of postcode. Therefore, we need convert postcode (in UK) to latitude/longitude using a UK postcode dataset.Alex Whittles has a blog post which suggests a number of UK postcode datasets, and also introduces how to convert postcode to geography data type and how to use the spatial data in SSRS report.

Below is the complete query for the dataset in this example (based on the query suggested by Alex Whittles).

SELECT p.postcode,
    geography::STPointFromText('POINT(' +
         CAST(MAX(p.longitude) AS VARCHAR(20)) + ' ' +
         CAST(MAX(p.latitude) AS VARCHAR(20)) + ')', 4326).STBuffer(2000)  AS Geog,
       Count(*)as [Count]
FROM [YOURSERVER_MSCRM].[dbo].[FilteredAccount] a
Inner join [UKPostcodeTable] p on  p.postcode =
  CASE WHEN
            CHARINDEX(' ', a.address1_postalcode)=0 THEN a.address1_postalcode
            ELSE LEFT(a.address1_postalcode, CHARINDEX(' ', a.address1_postalcode)-1)
           END
GROUP BY p.postcode

  1. Add a Map to the report which consumes the spatial data from the dataset we just created.

clip_image002

clip_image004

  1. Deploy the report we just created in BIDS on to MSCRM 2011.

  1. Publish the report for external use

clip_image007

  1. Get the URL of the deployed report (though web service of the report server)

  2. Create a IFRAME which links to the report (don’t forget to hide the toolbar of the report viewer by adding ‘rc:Toolbar=false’ to the URL), and add the IFRAME to a dashboard.

And then, we have a spatial map showing on MSCRM 2011.

image