Tag: pandas

Why Bother to Use Pandas “Categorical” Type in Python

When we process data using Pandas library in Python, we normally convert the string type of categorical variables to the Categorical data type offered by the Pandas library. Why do we bother to do that, considering there is actually no difference with the output results no matter you are using the Pandas Categorical type or the string type? To answer this question, let’s first take a simple test.

In this test, we create a data frame with two columns, “Category” and “Value”, and generate 50 millions rows in this data frame. The values of “Category” column are generated from a list of six predefined categories, [‘category1’, ‘category2’ … ‘category6’], and the values of “Value” column are generated from the list integer of [0 … 9].
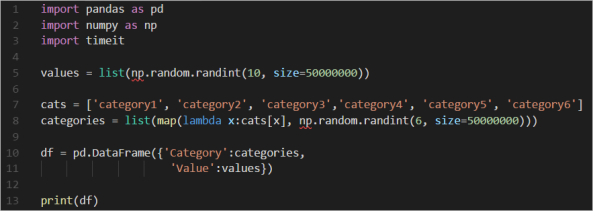
0102

We first time the execution of a group by operation against the “Category” column which is in the string type and also observe the memory usage of the “Category” column.

03

We then convert the “Category” column to the Pandas Categorical type, repeat the execution of the same group by operation and observe the memory usage of the “Category” column in Pandas Categorical type.

04

The result reveals a five times improvement on running speed and one eighth memory usage when converting the “Category” column to the Pandas Categorical data type.

05

This test result answers our original question that the reason to use Pandas Categorical data type is for the optimised memory usage and improved data processing speed. Then why does the Categorical data type have such magics? The answer is pretty simple, i.e. dictionary encoding.

If we open the source code of the Pandas Categorical class, we can see this class contains two properties, “categories” and “codes”.

06

After we printed the two properties for the “Category” column used in our test, we can see the “categories” property stores the dictionary of the six categories available for the “Category” column and the actual category information of the “Category” column for all the rows in the data frame is stored in the “codes” property in the format of integer number which points to the position of the corresponding category in the “categories” property.

07

08

In this way, Pandas Categorical data type takes much less memory space to store the category information in integer type compared to store in the original string type. The query operations on the category column scan less memory space and therefore the time used on the query is shorten.

Dictionary encoding is a common technique used for data compression. For example, Azure Analysis Service and Power BI also used dictionary encoding in their Vertipad engine to compress data to reduce memory usage and to increase query speed.

13fig04
*This figure is from  the book “Definitive Guide to DAX” authored  by Alberto Ferrari and Marco Russo


Extracting Features from IoT Sensor Data using Python

The previous blog post discusses three common patterns for extracting feature from IoT sensor data:

  • Window-based descriptive statistics
  • Seasonal pattern
  • Trend pattern

This blog post introduces how to implement those three patterns in Python.

  1. Window-based descriptive statistics

There are three main types of descriptive statistics based on what they describe: distribution (e.g., skewness and kurtosis), central tendency (e.g., mean, median, and mode) and dispersion (e.g., standard deviation, variance, and Range). Python pandas package provides functions to a comprehensive list of descriptive statistics. You can find the reference to those functions here.

The descriptive statistics need to be calculated within a time window context, e.g., the last 12, 24, 72 hours. We can use the rolling method in pandas to get the rolling time window.

For example, we have the hourly reading data from sensor A:a1

We can get the rolling window sizing as 12, 24, 72 hours and calculate the mean, sd, and skew of each window size.

data['SensorA_mean_12h'] = data['SensorA'].rolling(12).mean()
data['SensorA_sd_12h'] = data['SensorA'].rolling(12).std()
data['SensorA_skew_12h'] = data['SensorA'].rolling(12).skew()
data['SensorA_mean_24h'] = data['SensorA'].rolling(24).mean()
data['SensorA_sd_24h'] = data['SensorA'].rolling(24).std()
data['SensorA_skew_24h'] = data['SensorA'].rolling(24).skew()
data['SensorA_mean_72h'] = data['SensorA'].rolling(72).mean()
data['SensorA_sd_72h'] = data['SensorA'].rolling(72).std()
data['SensorA_skew_72h'] = data['SensorA'].rolling(72).skew()
data.tails(5)

The python code above will generate the features as:

a1

  1. Seasonal pattern

As discussed in last blog post, the features representing seasonal pattern can be extracted from the timestamp of the IoT sensor data using the built-in Python datatime class, such as:

data['DayOfWeek']=data['DateTime'].dt.weekday
data['IsWeekend']=np.where(data['DateTime'].dt.weekday>4, 1, 0)
data['IsWorkingHour']=np.where((data['DateTime'].dt.hour>=9) & (data['DateTime'].dt.hour<=17), 1, 0)
data['Year']=data['DateTime'].dt.year
data['Month']=data['DateTime'].dt.month
data['DayOfMonth']=data['DateTime'].dt.day
data.tail(5)

We can get the output as:

a2

  1. Trend pattern

We can use shift function to extract the features for representing the trend pattern in a time-series dataset.

data['SensorA_lag_1h'] = data['SensorA'].shift(1)
data['SensorA_lag_2h'] = data['SensorA'].shift(2)
data['SensorA_lag_3h'] = data['SensorA'].shift(3)
data['SensorA_lag_4h'] = data['SensorA'].shift(4)
data['SensorA_lag_5h'] = data['SensorA'].shift(5)
data['SensorA_lag_6h'] = data['SensorA'].shift(6)
data['SensorA_lag_7h'] = data['SensorA'].shift(7)
data.tail(5)

We can the output as:
a3