Update – I have suggested another approach here that allows users to dynamically specify the periods and the number of top items to evaluate, using the interactive dashboard slicers.
When analysing the best performers against a specific measure such as the best sold products, we sometimes need to take multiple periods into consideration. For example, we want to find the products that are not only ranked in Top 10 in this year but also in the other years. This blog post introduces how to achieve this type of calculations using DAX.
Here we will use Eurovision competition dataset as the example to compute the countries that are ranked in top 10 for both year 2015 and 2016.
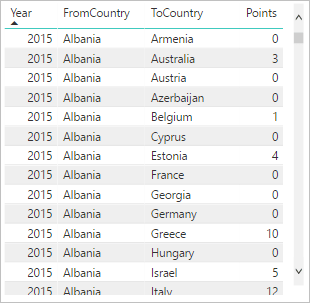
The Eurovision competition dataset contains the rows of country-to-country votes for each year.
To find the countries which are ranked in top 10 for both year 2015 and 2016, we first compute the top 10 countries for each year, using CALCULATETABLE function to filter on the year and TOPN DAX function to return the set of countries ranked in top 10 for that year. Then we use the INTERSECT function to return the countries appearing in both years.
Top Countries In Both 2015 And 2016 =
    INTERSECT(
        CALCULATETABLE(
            TOPN(10,
                SUMMARIZE(data, data[ToCountry]),
                CALCULATE(SUM(data[Points]))
             ),
            data[Year]=2016
        ),
        CALCULATETABLE(
            TOPN(10,
                SUMMARIZE(data, data[ToCountry]),
                CALCULATE(SUM(data[Points]))
             ),
            data[Year]=2015
        )
    )
The DAX script above will return the three countries which are ranked in top 10 for both year 2015 and 2016.

We can further improve the DAX script to make it return not only the name of the country but also the rank of the country for each year.

We can use the SUMMARIZECOLUMNS funciton combined with the RANKX function to computer the rank for all the countries and then use the NATURALINNERJOIN function to inner join the set we created earlier for computing the countries ranked in top 10 for both year 2015 and 2016.
Top Countries In Both 2015 And 2016 =
  NATURALINNERJOIN(
    CALCULATETABLE(
        SUMMARIZECOLUMNS(
                        data[Year],
                        data[ToCountry],
                        "Rank", RANKX(ALL(data[ToCountry]), CALCULATE(SUM(data[Points])))
                        ),
        data[Year]=2016 || data[Year]=2015
    ),
    INTERSECT(
        CALCULATETABLE(
            TOPN(10,
                SUMMARIZE(data, data[ToCountry]),
                CALCULATE(SUM(data[Points]))
             ),
            data[Year]=2016
        ),
        CALCULATETABLE(
            TOPN(10,
                SUMMARIZE(data, data[ToCountry]),
                CALCULATE(SUM(data[Points]))
             ),
            data[Year]=2015
        )
    )
  )
