One of my previous blog post introduces how to find the items which are ranked in top n for multiple periods, using the INTERSET and TOPN functions. However, that approach needs to hard-code the periods and the number of top items in the DAX scripts. This blog post introduces an approach that allows users to dynamically specify the periods and the number of top items to evaluate, using the interactive dashboard slicers.
In this blog post, we will still use the Eurovision dataset as example that contains the rows of country-to-country votes for each year.
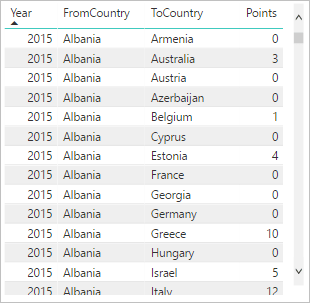
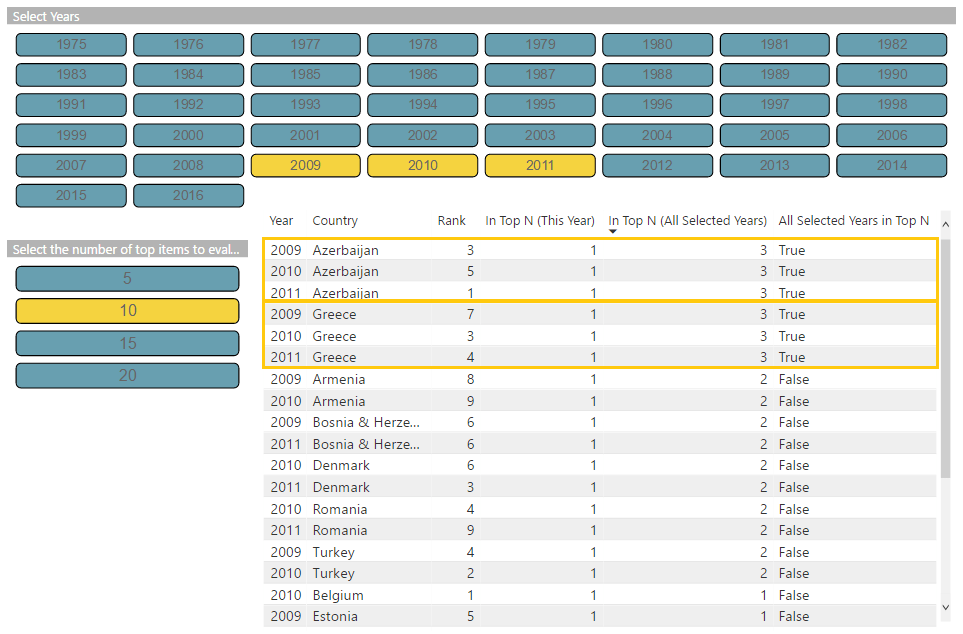
We will create four measures, including “Rank”, “In Top N (This Year)”, “In Top N (All Selected Years)”, and “All Selected Years in Top N”. These measures will be used in an evaluation context made of the combination of each year and each country. To build the evaluation context, we can use a Power BI table visual and add the “Year” and “ToCountry” columns from the Eurovision dataset to the table. The four measures will be added to the table later that evaluates the rank and whether in top n of each country in each year.
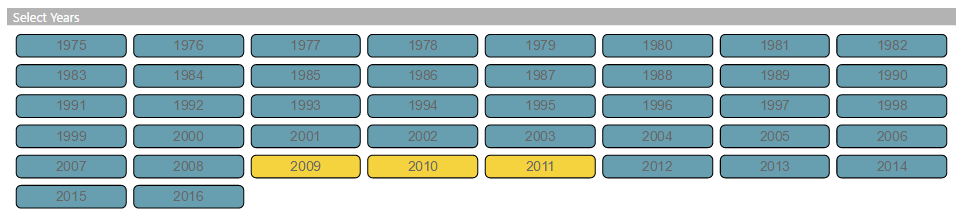
A “Year” slicer will be added to the dashboard that allows users to filter the table by the selected years. Any number of years can be selected and the selected years can be consecutive or nonconsecutive.
Measure – Rank
The first measure to create is the “Rank” measure that computes the ranks of the countries in each selected year.
Rank = RANKX(ALL(data[Country]), CALCULATE(SUM(data[Points])))
Measure – In Top N (This Year)
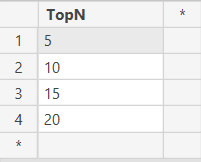
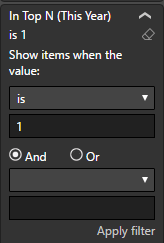
Based on the “Rank” measure, we will create the “In Top N (This Year)” measure that compute whether the current country is ranked in top n in the current year-country evaluation context. Here we need to allow users to dynamically specify the N (the number of top items) to evaluate. We can achieve that using a disconnected parameter table that defines the options for the N.
In the DAX measure, we can get the user selected N value using VALUES function which will be compared to the “Rank” measure we created earlier to evaluate whether the current country is in top N in current year context.
In Top N (This Year) =
    IF([Rank]<
        IF(HASONEVALUE('TopN'[Top N ]),
            VALUES('TopN'[Top N ]),
            10
        ), 1, 0)
We will then filter the table using the “In Top N (This Year)” measure that only keeps the countries ranked in the top N in at least one of the selected years.
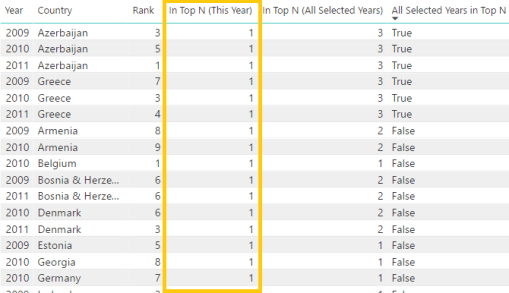
Measure – In Top N (All Selected Years)
After we applied the filter on the “In Top N (This Year)” measure, the table only contains the rows of countries ranked in top N in at least one selected years. If we count the rows in the filtered table by a country, we will get the number of selected years when this country is ranked in top N. This is what the “In Top N (All Selected Years)” measure will do.
In Top N (All Selected Years) =
   CALCULATE(
        DISTINCTCOUNT(data[Year]),
        ALLSELECTED(data[Year])
    )

Measure – All Selected Years in Top N
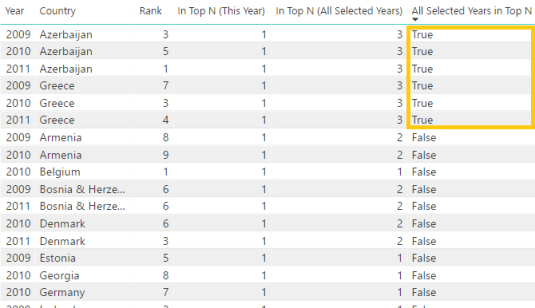
Now that we have the “In Top N (All Selected Years)” measure which tells us how many of the select years a country is ranked in top 10, we can then calculate the total number of the select years and compare it to the “In Top N (All Selected Years)” measure. If the value of the “In Top N (All Selected Years)” measure is equal to the total number of selected years, that means the country is ranked in top 10 in all the selected years.
All Selected Years in Top N =
    VAR NumberOfSelectedYears =
        CALCULATE(
            DISTINCTCOUNT(data[Year]),
            ALLSELECTED(data[Year]),
            ALLSELECTED(data[Country])
        )
    RETURN
        [In Top N (All Selected Years)] = NumberOfSelectedYears
Please find the pbix file here.
