
- Buy-Side Financial Data Engineering (1) – Overview
- Buy-Side Financial Data Engineering (2) – Financial Instruments
- Buy-Side Financial Data Engineering (3) – Market Data Management
The second article of my “Buy-Side Financial Data Models” focuses on the “Financial Instruments” data domain. Financial instruments data is complex and difficult to manage. In the meantime, it is crucial to support all sorts of business activities across an asset management business, especially for the middle and back office work, where the models, methods and algorithms to use depend on the characteristics of the financial instruments involved.
In this article, I will first give a brief description of the industry standards & models that I have investigated in my research and then talk about my thoughts on the difficulties of financial instruments data management. I will then suggest a framework for helping data professionals to organise and understand financial instruments data fields. With the support of the framework, I will present the core data fields of financial instruments in terms of their characteristics.
Financial Instruments Industry Standards
It is well recognised that the financial instruments data is complex, incomplete and incompatible, and many people have concerns about that. Therefore, many standards and models have been developed, by the government, regulatory agencies, and industry, to solve this challenge, and funnily this resolution itself turns out to be a challenge, possibly an even bigger one. Recently, I have been trying to classify, categorise and document most of the popular financial instruments, including their attributes and their characteristics on returns and risks. Because of that, I had a close feel of the standards and models that are related to Financial Instruments, and I have to say that there are a lot. Here is a list of them I have investigated that is open standard.
- EDM Financial Industry Business Ontology (FIBO) – FIBO is a semantic model and ontology for representing financial industry concepts and relationships that includes a list of packages related to financial instruments, including SEC, IND, LOAN, and DER. I found FIBO and FpML contain the most comprehensive coverage of financial instrument information compared to others.
- Financial Products Markup Language (FpML) – FpML is an XML-based standard developed by the International Swaps and Derivative Association (ISDA). This standard has excellent coverage of data definitions of financial derivatives, not only the data schema but also a rich set of static reference data related to financial derivatives. FpML is one of my main reference resources for investigating financial derivatives.
- Financial Information Exchange (FIX) Protocol – FIX is a messaging protocol for communicating trade-related information. I used to work with FIX for streaming trade reporting messages for real-time trading data reporting. There are a few component blocks containing financial instruments data definitions, such as Instrument, Underlying Instrument, IntrumentLeg, Product etc. However, the data field coverage is much lower compared to FIBO and FpML.
- OFR Financial Instrument Reference Database (FIRD) – The Dodd-Frank Act mandates the OFR (Office of Financial Research) to develop a set of standards for creating and describing financial instrument reference data to solve all sorts of problems with the financial instrument data. This should be the most relevant standard I have been after. However, the development of this standard is still at its early stage with limited coverage of financial instruments data.
- ISO 20022 Transactions and Financial Instruments Data Reporting (FITRR) – ISO 20022 is a global financial industry standard developed by ISO that provides a common message standard framework for various financial business domains. One of the modular, FITRR, contains financial instruments data definitions for supporting financial transactions reporting, however, the most of data entities in this modular are reverent to the trading process instead of the financial instruments reference data.
- ESMA Financial Instruments Reference Database System (FIRDS) – FIRDS records all those financial instruments reported by EU trading venues as being traded on them. FIRDS is a database system instead of an industry standard, but it contains a list of meta-information of all the financial instruments traded and reported.
Challenges of Financial Instruments Data Management
There is a massive number of financial instruments traded in all sorts of markets, through exchanges or over-the-counter. The number is continuously increasing, thanks to the creativity of our financial engineers. It is very difficult, if ever possible, to identify all the financial instruments with all the related fields and organise them in a perfectly structured model.
I am sure someone will question why on earth we need to understand every financial instrument. Yes, I totally agree that nobody needs to and is capable of understanding every single financial instrument. However, on the other hand, I do believe that financial data professionals need to build a high-level but comprehensive mental model/representation of the types of financial instruments (at least of those being traded within their organisations). In addition, they need to understand the business purposes, performance & risk characteristics, and limitations of each type of financial instruments and the data fields that represents those characteristics.
However, it is not that straightforward to build your mental model of financial instruments. Firstly, financial instruments are heterogeneous across different asset classes or even within the same asset class, especially for fixed income financial instruments. The financial instruments can have very different attributes that raise the challenges of forming a common model to represent them. In addition, a financial instrument can own a very flexible combination of features that causes difficulties in grouping and classifying the financial instrument. For example, even for the simple single stock, in terms of CFI classification, it can be classified by common/preferred, voting/non-voting/enhanced voting, registered/or not, perpetual/or not, redeemable/or not, cumulative/normal income, etc., then ends up more than 200 classification items. For debt instruments, there are many more potential features leading to more combinations, such as by callable, convertible, bullet/amortising payment, fixed/floated/step-up coupon, PIK/or normal, index-linked(equity/credit/inflation/..)/or not, etc. For derivative instruments, there are one or more layers of dimensions added, such as futures, futures on future, futures on option, and futures on swap.
For each feature mentioned above, a set of data fields are required to configure the feature. For example, the “callable” feature added on a bond requires additional data fields related to call window, call premium, call notification provision, call schedules, etc.
For a data professional, it is really not necessary to memorise and understand every single financial instrument and every data field related to every feature added on it. However, I think it would be a fair list of requirements for a financial data professional to meet:
- Have a mental model/representation of the high-level types of financial instruments from multiple dimensions.
- Understand the business purposes, characteristics and limitations of each high-level type of financial instruments and understand the common data fields for representing them.
- Once given a specific financial instrument, can locate its appropriate place in your mental model, and from there, can identify its specific, detailed features and characteristics.
A Framework for Understanding Financial Instruments Data
It was a real challenge to classify and organise financial instruments data. There are way too many features, characteristics and concepts to consider. Eventually, I worked out a framework to support me in analysing and organising financial instruments data. Financial instruments data contains master reference data, market data and fundamental data. This article focuses on the master reference data. The market data and fundamental data will be covered in the following articles of this series for discussing “Market Data” domain and “Research Data” domain.
The framework suggests analysing financial instrument data from three dimensions: asset class, derivative type, and embedded features.

For the “Asset Class” dimension, in my own “mental model”, as the diagram below depicts, I have six top-level asset classes, including Equities, Debts, Indicators, Currency, Commodities, and Collective Investment Vehicles. Strictly speaking, indicators such as rates and indices, are not assets. However, there are a big class of derivatives having those indicators as underlying. Under each top-level asset class, there are one or more levels of sub-classes. For example, the Debt asset class includes three 1st level sub-classes, including bond instruments, money market instruments, and structured instruments. The 1st level structured instruments include two 2nd level structured instruments, including MBS and non-mortgage-based ABS. The 3rd level MBS includes RMBS, CMBS, CMO.

The second dimension is the derivative type dimension, including forward, future, option and swap type. The derivative type dimension does not exist independently but instead depends on the asset class dimension.

From the “asset class” dimension and the “derivative type” dimension, we can have a 2-dimensional instruments matrix with one row representing an asset class, one column representing a derivative type, and the cross cell representing the financial instrument that is either a derivative product derived from an underlying asset in one asset class or a spot contract for the asset.

The third dimension is the features dimension including the specific features embedded in a financial instrument that add additional specific features such as “convertible”, “voting rights”, “leveraged”, or change some specific characteristics of the instrument such as “balloon payment”, “deferred coupon”, “inflation-linked”

Within the three dimensions, for an item in one dimension (either a specific asset class, derivative type, or feature), we can identify its business attributes and map the relevant data fields to represent those attributes. In this way, given a financial instrument, we can identify all related data fields from the sets of data fields representing the attributes for each dimension.
In the rest of this article, I will look into each dimension and identify the core attributes of the high-level types in the dimension. I am not that arrogant and crazy to think I can exhaust all attributes for all financial instruments. However, I will try to cover the main asset classes, derivative types, and features to form a framework or scaffolding for supporting your analysis of more specific financial instruments. As it is easier and more informative to explain features in the context of the asset or derivative type that they are associated with, I will write about the features while discussing the asset class dimension and the derivative type dimension instead of writing them in a dedicated section.
Asset Class Dimension
Common Attributes
Before diving into the attributes of each asset class, I will first summarise the common attributes that are not exclusive to any specific asset class. Please note that not all of those attributes have to be universally shared by all financial instruments. For example, some attributes are shared with all exchange-traded instruments but are not applicable to OTC instruments.
Identification – ID is arguably the most important attribute of a financial instrument. As a universally recognised ISO standard, when an ISIN code is available, it is strongly recommended to be used as the primary ID of an instrument. For OTC derivative instruments, ISDA recommends to use UPI (Unique Product Identifier) which was developed under the increased requirements on OTC derivative trade reporting. A list of alternative identifiers is normally required in case either ISIN or UPI (for OTC derivatives) are not available, such as the FIGI, SEDL, CUSIP, BLOM, RED ID, RIC etc.
Classification – a list of classification schemes has been developed by the government, regulatory agencies and industry to classify financial instruments. CFI is the globally recognised classification scheme. In addition, some other classification data fields can support data aggregations for reporting by different perspectives, such as asset class and derivative type.
Issuer – The core data fields required for an issuer includes: Name, CIK, Unique Company Identifier, Domicile, Active/Inactive data, Issue Country. Issuer industry is also an important dimension for data aggregating and cross-sector analysis. The data fields for common industry sector classification schemes need to be included, such as government classification schemes (NAICS, SIC, NACE) and commercial classification schemes (GICS, MSCI, ICB).
Restrictions – financial instruments can have explicitly declared restrictions over the instrument holding and trading. Some restrictions limit the investors’ holdings by domicile, holding period, and risk factor. Some restrictions limit the investors’ trading by disallowing day trading.
Summary of Data Fields:
- Identification – ISIN, UPI, FIGI, SEDL, CUSIP, BLOM, RED ID, RIC, Ticker Symbol, etc.
- Classification – CFI, Asset Class, Asset Group, Instrument Type
- Issuer – Name, CIK, Unique Company Identifier, Domicile, Active/Inactive data, Issue Country, NAICS, SIC, NACE, GICS, MSCI, ICB
- Restrictions – Investors’ Domicile Restriction, Legal Holding Restriction, Trading Restriction
Equities
Equities are the type of financial instruments issued by a company for raising capital through the sale of shares, i.e., the ownership of part of the company in return for cash. The investors of the equities investment become the shareholders who have a residual claim on the company’s assets (but after all other liabilities of the company have been paid). The investors profit from the dividend income and capital appreciation.
A single stock share is one of the simplest financial instruments (compared to derivatives and structured instruments). Apart from the general attributes such as primary exchange, trading currency, dividend distribution method, and dividend schedules, etc., a stock share instrument can have the following features.
Voting Rights – Voting rights are one of the main features of a stock share financial instrument. Anyway, as the owners of the invested company (at least a part of it), voting rights let them have their say in major company decisions, especially for activist shareholders such as hedge funds. There are a few of voting rights types, from no voting, statutory voting (one vote per share), to cumulative voting (total voting rights = number of shares owned x the number of board directors). There might be different share classes of common shares, each with different ownership and voting rights.
Preferred Stock – Companies might also issue preferred stock to avoid diluting existing voting rights. From investors’ perspectives, the preferred stock is also attractive to them for the relatively reduced risk and fixed dividend payments. Compared to the common shares, preferred stock doesn’t grant investors voting rights, but in return, the preferred dividends are fixed and normally higher than common share dividends. In addition, preferred stock ranks higher when claiming company assets in case of company bankruptcy. Preferred stock can be cumulative (unpaid dividends must be paid in full before dividends on common shares can be paid) or not. It can also be participating (entitled to additional dividends for exceeded profits and additional distribution of the company’s assets in case of company bankruptcy) or not.
Convertible, Redeemable & Retractable – A preferred share can be convertible into a specified number of common shares depending on the pre-defined conversion ratio. A preferred share can also be redeemable or retractable: the redeemable share gives the issuer the right to redeem the stock while the retractable share gives the shareholder the right to redeem the stock.
Depository Receipts – A depository receipt can be viewed as a special type of stock share. It represents an economic interest in a foreign company but it can be traded as an ordinary share on a local exchange. A foreign company first deposits its shares with a local bank, and the bank then issues a specific number of receipts representing the deposited shares based on a pre-defined ratio. The receipts carry the same return and risk characteristics as the original foreign shares. it is a method for foreign companies to raise capital from the local market and for local investors to invest in foreign companies. A depository receipt can be sponsored (foreign companies are involved in the receipts issuance, and investors have the same rights as those direct owners) or unsponsored.
Summary of Data Fields:
- General – Primary Exchange, Official Place of Listing, Trading Currency, Listing Date, Market Segment
- Dividend – Dividend Distribution Method (reinvestment/payment), Dividend Schedules (Next Declaration Date, Next Ex-Date, Next Record Date, Next Pay Date)
- Voting Rights – Voting Share Type (Non/Statutory/Cumulative), Number of Votes per Share, Share Class
- Preferred Share – Preferred Fixed Rate Dividend, Is_Perpetual, Is_Cumulative, Is_Participating, Dividend Rate Type (Auction/Adjustable/Fixed)
- Convertible Redeemable & Retractable – Conversion Ratio, Minimum Redemption Price, Redemption Premium, Earliest Redemption Date, Retraction Provision, Retraction Type (Soft/Hard), Extendable Maturity Date, Extendable Redemption Date
- Depository Receipts – ADR Type (Unsponsored, Sponsored Level 1, Sponsored Level 2, Sponsored Level 3), Underlying Security Ticker, Exchange, Country, Sector, Depository
Debts
I have to admit that I did feel struggling to write up the Debts section. The Debts asset class of financial instruments contain so many elements and so many angles we can reach from. Eventually, I think I should go back to the most basic nature of debts. To make the reading (and writing) less boring, I will bring in two of my favourite characters, Homer and Garfield, to set up some contexts.

Now let’s start from the simplest borrow case, let’s say Homer wants to borrow some money. Garfield has some free money and he is keen to make some interest from it. For Garfield, the creditor, he needs at least to know the following information for him to decide whether to lend:
- Who is the guy wanting to borrow money from me?
- Is it safe to lend my money to him? Wait… does this guy have sufficient income to repay my money?
- This guy looks not have a decent income, I’d better holding something from him in case he can’t repay my money, or have someone more trustworthy who can g?
- How much money will he want to borrow and how long?
- How much interests can I have?
- What is the principal payment and interests payment arrangement?
- What is the contractual agreement I need to make with that guy to protect my investment?
Homer, the debtor, needs to provide all that information. Let’s say Homer decided to use the Bond contractual agreement as the vehicle for his borrowing. He first needs to state how much money in total (Amount Issued) he needs and how long he needs to borrow (Maturity Date). For each bond he will issue, He needs to decide the face value (Par Value), the discount or premium for the initial sale (Issue Price), when to issue (Issue Date), where to issue (Issue Country, Primary Exchange) and at which currency (Asset Currency, Settlement Currency, Income Currency).
In addition, Homer needs to let Garfield, the investor, know the payment arrangement of the principal and interests. For principal repayment, is the entire principal amount paid back at maturity (Bullet Bond), or paid periodically over the Bond term (Amortizing Bond). For interests, the coupon, how often is the payments (Payment Frequency), what is the rate of interest (Coupon Rate), is the rate fixed (Fixed-Rate) as pre-determined or floated (Floated-Rate) based on a Market Reference Rate (MRR) plus a fixed (Spread) which represents credit status of the issuer. There is a chance that the Market Reference Rate might change too much which affects the issuer or investors’ expected cash flow. To mitigate that, to protect the issuer, a cap can be set up to prevent the rate from raising above a level (Rate Reset Cap) or prevent the change of the rate for a reset over a set unit (Rate Reset Change Cap). To protect investors, a floor can be set up to prevent the rate from falling below a level (Rate Reset Floor, Rate Reset Change Floor). The float-rate can be (Collared), i.e., have both cap and floor set up. The rate can also be (Step-Up), i.e., the periodical coupon rate increases by specified margins (Step).
From Garfield’s, the investor’s, point of view, the main concern is over the credibility of the issuer. Therefore, He needs to understand the income sources of the issuer for the repayment of the Bond principal and interests. For the government or international organisation-backed issuers (Supranational, Sovereign, Nonsovereign-Government, and Quasi-Government), the credit is high because they have incomes directly or indirectly guaranteed by government taxing. For corporate issuers, in addition to the income sources, more information is required to understand their creditworthiness. The credit agency rating is normally required, such as (Moody’s, S&P, and Fitch). Bonds can be classified as (Investment-Grade) if the credit rating is above Baa3 (Moody’s) or BBB- (S&P, Fitch), otherwise, the bonds are classified as (High-Yield). For the high-yield bonds, even though the interest rate is higher, additional guarantees might be required, in the forms of (Secured) bonds, i.e., backed by assets or financial grantees, Collateral-backed, and credit enhancements.
Summary of Core Data Fields
- Issuer – Issuer Type (Supranational/Sovereign/Nonsovereign-Government/Quasi-Government/Corporate), Income Sources, Credit Grade (Investment/High-Yield), Credit Rating
- Issuance – Issue Price, Par Value, Issue Date, Dated Date, Amount Issued, Amount Outstanding, Issue Country, Issue Name, Country of Risk, Asset Currency, Settlement Currency, Income Currency, Primary Exchange
- Maturity – Maturity Date, Maturity Price
- Payment – Principle Payment Type, Coupon Type (Fixed/Floating/Inverse Floating/Variable/Step), Coupon Rate, Day Count Basis, Payment Frequency, Business Calendar, Interest Payment Timing, Accrued Interest Type, First Coupon Date, Last Coupon Date, Step
- Floating Rate Specific – MRR, Spread, First Rate Reset Date, Reset Frequency, Reset Lookback Days, Reset Lookback Days Type, Reset Lockout Days, Reset Lockout Period, Coupon Rate Fixing Method, Rate Reset Change Cap, Rate Reset Change Floor, Rate Reset Cap, Rate Reset Floor
- Credit Enhancements – Credit Enhancement Source (Internal/External), Internal Credit Enhancement Type (Subordination/Overcollateralization/Excess Spread), External Credit Enhancement Type (Bank Gurantees, Letters of Credit)
So far, we have the core attributes of a bond that are base attributes for all types of bond products. Now, let’s have a look at some features that can be added.
Let’s say Garfield starts to be unhappy with his bond investment because the prices of everything are being increased too quickly, much quicker than his bond interest incomes. He wants a bond with interests dynamically increased along with inflation. The Inflation-linked bond, one of the index-linked bonds, is something he is after. Taking TIPS (Treasury Inflation Protection Securities) example, it is issued by the U.S. Government and is linked to US CPI index. The inflation-linked feature enables a fixed real return to protect the investor from inflation risk. The inflation-linked feature can be applied to interests only (Interest-Indexed), both interests and principals (Capital-indexed or Indexed Annuity).
- Index-Linked – Underlying Security ID, Calculation Type, Index Precision, Cash Flow Type (Zero-coupon-indexed/interested-indexed/capital-indexed/indexed-annuity)
For another scenario, let’s assume Homer, the bond issuer, owns a publicly listed company and the price of the company stock is rising. If the bond is embedded with a “convertible” feature, Garfield, the bondholder, can convert the bond into a pre-determined number (Conversion Ratio) of common shares of the issuer at a pre-determined share price (Conversion Price). This allows Garfield to benefit from the price appreciation of Homer’s stock share. However, the yields on convertible bonds are lower than the otherwise identical non-convertible bond that favours the issuer.
- Convertible – Conversion Ratio, Conversion Price, Underlying Security ID, Underlying Issue Name, Underlying Type
Homer, the issuer, can also add the “Callable” feature to his bond that grant him to redeem the bond before maturity in case of market interest rate declines or his creditworthiness improves (in both cases, he can refinance the debt with lower costs). The bond can be redeemed at the pre-determined price (Call Price) either at any time starting on the first (Call Date) under (American Style), on the call date only (European Style), or on specified dates following the call date (Bermuda Style). (Call Protection Period) can also be pre-determined which specifies the initial period when the bond is prevented from being called. In nature, a callable bond = noncallable bond + call option.
- Callable – Call Type (European/American/Bermuda/Multi-Callable), Call Price, Call Date, Call Protection Period, Yield to Call, Yield to Worst, Call Premium
On the other hand, a “Putable” feature can also be added to a bond that grants bondholders the right to sell the bond back to the issuer at a predetermined price (Put Price) on a predetermined date (Put Date) before the maturity date. In nature, a putable bond = nonputable bond + put option. The holdholders need to pay more for the putable bond, and the additional cost is the price of the put option.
- Putable – Put Type, Put Price, Put Date, Put Protection Period
A bond interest payments can also be deferred, i.e., don’t pay for the first few years after issuance, but then pay a higher coupon for the remaining holding periods. The bond issuers can benefit from the deferred payments when they expect short incoming cash flow at an early period. On the other hand, for the sake of bond investors, the bond issue price can be much lower than the par value.
- Deferrable – Deferred Period
Up to now, we have discussed the basic attributes and features of a bond. Now, let’s move to something a little bit complex, i.e., the asset-backed bonds, which are created through the (Securitization) process.
Let’s go back to our Homer and Garfield. Now, Homer wants to buy a house and needs a mortgage loan. In the traditional way, investors, such as Garfield, deposit money to a bank. The bank then lent the money as a mortgage loan to Homer. Homer has the house and repays the principals and interests of the loan at an Amortization schedule to the bank. The bank then periodically pays interest to the investors.
However, there are some disadvantages of this model to all parties involved. For banks (lenders), considering the risks and the cost burden they take for managing the loans, the number of loans they can supply to the homebuyers will be limited. Because of that, for homebuyers, it is not always easy and cheap to have mortgage loans from banks. For investors, they are not able to invest and gain exposure to mortgage assets instead they can only participate by holding deposits which offer bad returns.
To solve those problems, Securitization is invented to repackage a pool of certain types of assets into an interest-bearing bond security. With securitization, Homer still gets loans from a bank or other financial intermediaries but more easily and cheaply. The lender sells Homer’s and many other homebuyers’ loans to an SPV (special purpose Vehicle). The SPV then takes the legal ownership and risks of the loans and issues bonds backed by the cash flows generated from the pool of loans. Garfield, the investor, can then buy the securitised bond as other normal bonds. The bank (lender) plays much less role in this process where they just originate the loans and then sell the ownership and risks to SPV, therefore they can originate more loans. Homebuyers have more chances for cheap mortgage loans, and investors have higher gains from securitised bond investments.

This securitised bond discussed above is a type of MBS (Mortgage-Backed Securities). There are two types of MBS, the RMBS (Residential Mortgage-Backed Securities) when the pool of mortgages is for residential properties, and the CMBS (Commercial Mortgage-Backed Securities) when the underlying pool consists of commercial mortgages.
There are normally two classes of RMBS, (Agency RMBS) that are issued by government agencies (e.g., Ginnie Mae) or government-sponsored enterprises (e.g., Freddie Mac and Fannie Mac), and (Nonagency RMBS) that are issued by private entities. The Agency RMBS are considered as bearing high creditworthness and only (Conforming, i.e., must meet specified underwriting standards) mortgages are qualified, while the Nonagency RMBS take more default risk and allow (Nonforming mortgage). RMBS is a type of (Pass-Through Security), i.e., the shares of the mortgage pool are passed to investors. Therefore, the investors do take the default risk and prepayment risk of the RMBS. The default risk is considered to be low on RMBS considering the chances of defaulting on the repayments for the large number of mortgage loans at the same time is low. However, the prepayment risk is the investors’ main concern that causes the uncertainty with the investors’ expected cash flows.
The cash flow uncertainty is a big issue to institutional investors who need to match the cash flows to their portfolio. CMO (Collateralized Mortgage Obligations) can be used to mitigate this issue. The idea behind CMO is actually very simple, i.e., redirect the cash flows from mortgage pass-through securities into different tranches. The different tranches here have different prepayment risk exposures that suit investors with different risk appetites. The principal payments will be made to tranches in a sequential order, i.e., allocate all the available principal payments to the first tranche until it is fully paid off and then move on to fill the next tranche. In this way, the investor principal payments cash flows are re-engineered away from the underlying mortgage pass-through cash flows but instead to align with the investors’ cash flow requirements.
From an investors’ perspective, the MBS bonds share most of the same attributes with the normal bonds, as those discussed earlier. However, there are some additional attributes exclusively owned by MBS bonds. Firstly, an MBS bond is backed by a mortgage pool. The investors need to have the information of the pool, such as (Mortgage Product Type), (RMBS Sectors), (LTV Ratio Range). As the Mortgage loans in a pool do not all carry the same coupon, maturity, and life, the weighted average coupon (WAC) rate, the weighted average maturity (WAM), and the weighted average loan age (WALA) are calculated. Secondly, MBS bond issuing and operating involves multiple participants with different responsibilities, such as Originator, SPV, Trustee Agent, Underwriter, Rating Agencies, and Guarantors.
Not only mortgage loans but also many other assets can be used as collateral in securitisations, such as credit card receivables, automobile loans, and customer loans. Those securities backed by non-mortgage assets are named Non-mortgage ABS. One special case is the CDO (Collateralized Debt Obligation). Unlike CMO which is backed by mortgage type of assets, CDO can be backed by a diversified pool of securities, bonds, loans, CDS, ABS, and even other CDOs.
Additional Data Fields
- Assets Pool – Pool Reference Number, Collateral Pool Type, Constitutes, Weighed Average Coupon (WAC) rate and Weighted Average Maturity (WAM), Weighted Average Life
- Participants – SPV, Originator, Trustee Agent, Underwriter, Rating Agencies, Guarantors
- MBS – Mortgage Product Type (Residential/Commercial), MBS Sectors (Agency/Non-Agency), Issuing Agency (Ginnie Mae/Fed NatlMtg Assn/…), Is_Conforming, LTV Ratio Range, Agency Pool (FNMA/GNMA Platinum/I/II)
- CMO & CDO – Tranche ID, Tranche Class, Tranche Sequence ID, Tranche Par Amount, Tranche Rate
Collective Investment Vehicles
“Collective Investment Vehicles (CIV)” refers to pooled investments offered to investors, such as Equity Funds, Mutual Funds, Hedge Funds, FoF, Pension Funds, REITs, Sovereign Wealth Funds, and Exchange-Traded Fund (ETF). Different types of funds can have different characteristics. For example, Mutual Funds and Hedge Funds have very different investment strategies and administration styles. It is difficult to exhaust all attributes of all fund types and fund is not the focus of this article, therefore, I will keep this section brief and just list the common attributes related to collective investments.
Common CIV Data Fields
- Basic Info – Fund Name, Fund Status, Fund manager, Manager Start Data, Fund Launch Date, Supervisory Authority, Domicile, Currency
- Subscription – Subscription Terms, Minimum Initial Subscription Units, Minimum Subscription Units
- Redemption – Redemption Terms, Redemption Restriction, Minimum Remaining Holding Units, Maximum Redemption Units
- Distributions – Transfer Agent, Distribution Strategy, Share Classes, Dividend Payment Frequency, Most Recent Payment Date, Most Upcoming Payment Date.
- Holdings – Asset Allocation Strategy, Weighting Schema, Replication Method
- Classifications – Fund Type, Asset Class type, Asset Class Size, Asset Class Style, Region, Strategy, Sector, Industry, Active/Passive, Morningstar Category
- Costs – OCF (ongoing charge figure), Transaction Cost, Performance fees, Expense Ratio
- minimum investment information, net assets, investment strategy, inception date, and much more.
- Latest Performance Snapshot – (X) Months NAV High/Low, Historic Yield
- Latest Risk Snapshot – Risk Level, Alpha, Beta, Information Ratio, Sharpe Ratio, Tracking Error
Indicators, FX & Commodities
The indicators (indices and interest rates), FX, and Commodities are mainly traded as underlying assets of financial derivative instruments. When there are indeed many spot currency and commodity tradings for all sorts of business purposes, investors who focus on hedging risks and profiting from asset pricing changes will trade on the derivatives instead of directly on the underlying. The derivatives instruments will be covered later in the next section. Here I will discuss some most traded derivatives that have indices, interest rates, FX, and commodities as underlying.
Stock index derivatives are one of the most exchange-traded derivatives that are required for hedging risks in a stock-based portfolio. S&P 500, Nasdaq-100(US Tech 100), EURO STOXX 50, FTSE (UK 100), Hong Kong 50 (China 50), 40 (Germany 40), Nikkei 225 (Japan 225) are among the indices underlying the most traded derivatives. Sector/Style indices are popular underlying for derivative products as well, such as Crypto 10 index, Global X Lithium index, Real Estate Giants index. In addition, the VIX volatility index, the market “fear gauge” indicator, is getting widely used.
The interest rate derivatives can be grouped into two categories: STIR (Short-Term Interests Rate) and long-term interests rate derivatives. GME Group issues the most traded STIR derivatives based on 3-Month SOFR, 30 Day Fed Fund, 1-Month SOFR, Eurodollar, SONIA, and occupies over 90% STIR market. The long-term interest rate derivatives are mainly based on the government-issued note or bond rates, such as the widely traded 10Y/5Y/2Y Treasury Notes and the 30Y Treasury Bond.
The currency derivatives have the FX currency pair rates as the underlying. Apart from the speculation purpose, currency derivatives are mainly used to hedge the foreign exchange risks that are one of the main risks in international trading. The table below lists the most traded currency derivatives in 2023 provided by WFE 2023 market report.

Commodity derivatives are the type of financial instruments linked to the price changes of underlying commodities, including soft commodities such as agricultural goods or livestock and hard commodities such as natural resources. The commodities underlying a derivative are traditionally required to be tangible, however, intangible things, such as weather, are now also classified as commodities. The table below lists the most traded commodity derivatives in 2023 provided by WFE 2023 market report.

Derivative Dimension
In the previous section, I looked into financial instruments from financial asset perspectives. In this section, I will discuss the attributes of financial derivatives whose value is derived from the performance of the underlying financial asset. Before looking into the four specific types of derivatives (i.e., Forwards, Futures, Options, and Swaps), let’s first have a quick summary of the common characteristics of financial derivative instruments.
Firstly, a financial derivative is a contract between two or more parties. Unlike a stock that carries ownership in a company and a bond that carries a right to fixed interest income, the value of a derivative contract is decided by the fluctuations in the underlying asset. Compared to stocks and debts, derivatives trade is a zero-sum game. One party’s win is another party’s loss.
Secondly, derivatives can be traded privately over-the-counter, therefore, it is much more flexible on the contract arrangements to meet the parties’ special risk managment and cash flows requirements. In the meantime, OTC derivatives carry more counterparty risks than exchange-traded derivatives. That leads to increased remands of CCP (Central Clearing Counterparty) involvement.
Thirdly, in the nature, what derivatives trade is the specific financial risks, such as interest rate risks, FX rate risks, credit risks, and market price risks. One party of a derivative trade might be more suitable and capable of managing some specific type of risks, so they are more willing to take the risks from another party in exchange for profits from taking the risks.
Fourthly, derivatives contracts are usually settled by net payments of cash. No or little cash payment is required when starting the initial contracts. High leverage can be deployed in derivatives trading that multiplies both returns and risks.
In the remaining of this section, I will discuss the four main types of derivatives, Forwards, Futures, Options and Swaps.
Forwards
A forward contract is a non-standardised, over-the-counter traded agreement to (Buy or Sell) a specified (Contract Size) of an (Underlying Asset) at a specified (Forward Price) of a specific (Currency) at a specified (Delivery Date) in the future.
At the time when the contract is made, let’s mark the time as ‘t(0)’, there is no upfront exchange of payment, but instead the exchange of the underlying asset and the payment at the Forward Price, ‘F(T)’, happens at the Delivery Date, let’s mark it as ‘t(T)’. The spot price of the underlying asset will be changing along between the time t(0) to t(T).

On the Delivery day, the payoff for the buyer is S(T) – F(T) and the payoff for the seller is F(T) – S(T). For example, let’s say the pre-agreed forward price for the underlying asset is £100 and the spot price for the underlying asset is £120, then the buyer makes £20 profit because the buyer could immediately sell the underlying asset (that he or she just bought at the price of £100) to the market at the price of £120.
The payoff diagram below shows the profits made by the buyer and seller at the different spot prices on the delivery date. From the diagram, we can see that the higher the spot price at maturity (delivery date) the better for the buyer and the worse for the seller. For a forward contract, the buyer’s profit equals to seller’s loss, the zero-sum game.

- Forwards – Underlying Asset, Buy/Sell, Contract Size, Forward Price, Contract Currency, Delivery Date
Futures
Futures are very similar to forwards, apart from the following differences:
Firstly, when forwards are mostly over-the-counter (OTC) traded, the futures are exchange-traded. For a future that can be traded at an exchange, unlike a forward that is customised to meet the special needs of the counterparties, the future contract needs to be standardised. The size of future contracts (Contract Size) needs to be uniform and the notional amount of a trade can be calculated as (Contract Size) * (Quantity) of contracts involved in the trade. The other basic attributes of the future contract, (Underlying Asset), (Buy or Sell), (Future Price), (Currency), (Delivery Date), need to be consistent with all contracts of the future. As the futures are traded in an exchange, the exchange-related info should also be provided, such as Name and MIC of the exchange, trading hours, price quotation, tick value, fees, and settlement method. One main advantage of futures compared to forwards is the better liquidity, thanks to the standardisation of the contracts and being traded at exchanges.
Secondly, futures are settled through an established clearinghouse that reduces the counterparty risk for both parties. In addition, futures are daily settled which could further reduce the counterparty risk as the counterparties can realise gains and losses on a daily basis. At the end of each day, the clearinghouse mark-to-market (MTM) the future contracts to calculate the end-of-day market values of the future contracts. Each counterparty deposits an (Initial Margin) into a margin account held at the exchange. The margin account is used for the daily future contract settlement. For the counterparty making a loss on the day, the loss will be realised in the margin account. When the amount in the margin account falls below the (Maintenance Margin), a margin call will be made to the counterparty to request additional funds to get the margin account back to the initial margin level.
- Futures – Underlying Asset, Buy/Sell, Quantity, Contract Size, Future Price, Contract Currency, Delivery Data, Initial Margin, Maintenance Margin
- Exchange – Exchange Name, MIC, Commissions, Trading Hours, Price Quotation, Tick Value, Settlement Method
Options
Options contracts can be either standardised or customised, traded over-the-counter or exchange-traded. Unlike forwards and futures (and the swaps to discuss later) that are the “forward commitments” contracts, options are the “contingent claims” contracts, i.e., the option buyers have the right to transact the trade and the option sellers have the obligation to fulfil the transaction if the buyers decide to exercise.
The right to (Long/Buy) an option at the option (Expiration Date) of (European Options) or at any time from contract inception to expiration of (American Options) is a (Call Option). The right to (Short/Sell) is a (Put Option). The pre-arranged buy or sell price is called (Strike Price). The option buyers (either call or put options) need to pay a (Option Premium) to the option sellers for exchanging the buy right.
At the time when an option is purchased, i.e. t(0), the strike price is agreed. During the period from contract inception to expiration, taking a call option as an example here, when the spot price is lower than the strike price, marked as “X,” here, the option is said to be out-of-the-money. When the spot price is higher than the strike price, the option is said to be in-the-money. when the spot price happens to be equal to the strike price, the option is at-the-money. At the expiration date, t(T), if the option is in-the-money and the payoff is higher than the option premium the buyer spent for the option, the buyer makes a profit as S(T) – X – Premium. If the option is out-of-the-money, for anyone who is not insane, the option will not be exercised and the option buyer makes a loss as -Premium.

From the payoff diagram for the long call option contracts below, we can see that the options start to be worth some money when the spot price > strike price, and the option buyers can make an even when spot price = strike price + premium, and make money when the spot price is further higher and the potential profit can be theoretically indefinite.

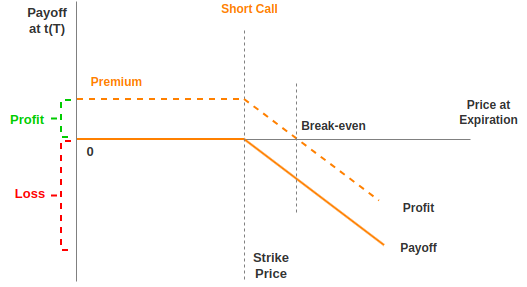
For the counterparty of the call option buyers, i.e., the call option sellers, the payoff and profit status are exactly opposite. The option sellers have the floating profit of the option premium from the inception of the option and they can realise the profit if the spot price does not reach the strike price plus the premium cost. However, after the break-even point, the option sellers make a loss and theoretically the loss can be indefinite.
- Options – Underlying Asset, Option Type (Put/Call), Long/Short, Quantity, Contract Size, Strike Price, Exercise Type (European/American), Premium, Expiration Date
Swaps
A Swap contract is an agreement between two counterparties to exchange a series of cash payments at a pre-arranged (Payment Frequency) on the series of (Settlement Dates) for a pre-agreed (Tenor). Swaps are settled on a net basis, therefore the amount of the cash payment at one settlement date is the difference of the accrued interests between the swapped rate that is paid only by the “lose” side. The accrued interests are calculated based on the considerations of (Day Count Conversion), (Holiday Calendar), (Business Day Convention), and (Notional Amount) of the contract.
For the plain vanilla swap, the basic form of swaps, a (Fixed Interest Rate) is exchanged for a (Floating Interest Rate Index). To give an example here, let’s drag Homer and Garfield on the stage again. Let’s say Garfield has a debt with a bank on a floating interest rate. Garfield feels uncomfortable with the uncertainty of the interest rate movement in future. To mitigate the interest rate risk, he wants to convert the floating rate debt into a fixed rate debt. On the other hand, Homer has a strong belief that the Fed will cut the Fed reserve interest rate very soon due to the high unemployment rate, and he wants to make some money out of it. Therefore, Garfield and Homer make a swap contract based on the notional amount of Garfield’s debt. In terms of the swap contract, Garfield and Homer will exchange the rate and have the cash settlement quarterly for a total 3 years period. At each settlement date, the difference of accrued interests is paid from the “losing” side to the “winning” side.

Swaps have been one of the fastest-growing types of derivatives due to their simplicity in hedging common and specific financial risks. Apart from the plain vanilla swap, many different types of swaps are widely used, such as:
- Overnight Index Swap (OIS) – Fixed Rate vs Floating Rate OIS Index (e.g., Sonia, FedFunds).
- Currency Basis Swap – Floating Rate vs Floating Rate (with different floating rate indices of the same currency), e.g., 3v1, 3v6 or 3v12.
- Cross-Currency Basis Swap, Float/Float – Floating Rate vs Floating Rate of different currencies, e.g., 3m Libor vs 3m Euribor.
- Cross-Currency Basis Swap, Fixed/Float – Fixed Rate vs Floating Rate of different currencies.
- Cross-Currency Basis Swap, Fixed/Fixed – Fixed Rate vs Fixed Rate of different currencies.
- Inflation Swap – Fixed Rate vs Floating Inflation Index Rate.
While many swap types are for mitigating interest rate risk, there is one type of swap widely used for managing credit risk, i.e., the CDS (Credit Default Swap). Compared to an interest rate swap, CDS is more like an insurance contract that protects the CDS buyer at any pre-agreed default event of an underlying, such as a high-yield bond. For example, let’s say Homer owns a bond that was issued by a company falling into some kind of trouble at this moment. To avoid a loss on the bond due to a potential default event, Homer and Garfield made a CDS contract that requires Homer to pay an agreed premium to Garfield quarterly. In case any pre-specified default event happens to the bond, Garfield has to buy Homer’s bond at par value.

Swap Date Fields
- Swaps – Notional Amount, Tenor, Counterparty1, Counterparty2, Payment Frequency, Settlement Dates
- Fixed Leg – Fixed Interest Rate, Day Count Conversion, Holiday Calendar, Business Day Convention
- Floating Leg – Floating Interest Rate Index, Floating Reset Dates, Day Count Conversion, Holiday Calendar, Business Day Convention
- CDS – Coupon Rate (25bp, 100bp, 500bp…), Default Events, Legal Protection Effective Date, Premium Payment Frequency, Payment Dates
References
- BGC. (2020). “BGC Derivative Markets, L.P. Contract Specifications”. https://www.bgcsef.com/wp-content/uploads/2020/12/BGC-SEF-Contract-Specifications_12-29-20.pdf
- Bodie, Z., Kane, A. and Marcus, A. (2017). “Investment”. McGraw-Hill Education
- BNY Mellon. (2024). “Data & Analytics Product Documentation”. https://eagledocs.atlassian.net/wiki/spaces/DASDocumentation/overview?mode=global
- CME Group. (2024). “OTC Trade Reporting”. https://www.cmegroup.com/confluence/display/EPICSANDBOX/OTC+Trade+Reporting
- Crouhy, M., Galai, D. and Mark, R. (2006). The Essentials of Risk Management. McGraw Hill.
- Crescenzi, A. and Roman, M. (2021). The Strategic Bond Investor, Third Edition: Strategic Tools to Unlock the Power of the Bond Market. McGraw-Hill Education
- EDM Council. (2024). “Financial Industry Business Ontology”. https://spec.edmcouncil.org/fibo/ontology
- EUREX. (2024). “EUREX.com”. https://www.eurex.com/ex-en/markets
- ESMA. (2024). “Financial Instruments Reference Database System (FIRDS)”, https://registers.esma.europa.eu/publication/searchRegister?core=esma_registers_firds
- Fabozzi, F. (2002). “The Handbook of Financial Instruments. 1st edition”. Hoboken, New Jersey: John Wiley & Sons, Inc.
- FIX Trading Community. (2024). “Financial Information eXchange (FIX®) Protocol”. https://www.fixtrading.org/what-is-fix/
- IMF. (2015). “Handbook on Securities Statistics”
- ISDA. (2024). “FpML”, https://www.fpml.org/
- ISO. (2024). “ISO 20022 Transactions and Financial Instruments Data Reporting (FITRR)”, https://www.iso20022.org/financial-repository
- OFR (Office of Financial Research). (2024). “Financial Instrument Reference Database (FIRD)”, https://www.financialresearch.gov/data/financial-instrument-reference-database/
- VettaFi. (2024). “ETF Database”. https://etfdb.com/
- Wiley. (2023). “CFA Program Study Guide”. Wiley
- World Federation of Exchange. (2023). “FY 2023 Market Highlights”. https://www.world-exchanges.org/storage/app/media/FY%202023%20Market%20Highlights%20Report%20v3.pdf
