Anomaly detection is a very common use case in IoT related deployments. A new ANOMALYDETECTION operator has been recently added into Azure Stream Analytics and is currently at public preview.
ANOMALYDETECTION operator detects anomalies based on Exchangeability Martingales (EM) that supports online test of the exchangeability of a sequence of event values. When the distribution of the sequence of event values is invariant, this sequence of event values is exchangeable. If the distribution of the sequence of event values is changed, a potential anomaly occurs.
This is the syntax of ANOMALYDETECTION operator, which check whether the current event value is anomaly against a sliding window of time period defined by the OVER clause.
ANOMALYDETECTION(\) OVER ([PARTITION BY \] LIMIT DURATION(\, \) [WHEN boolean_expression])
ANOMALYDETECTION operator returns three scores (BiLevelChangeScore, SlowPosTrendScore, and SlowNegTrendScore) corresponding to the three types of anomalies:
- Bidirectional level change
- Slow positive trend
- Slow negative trend
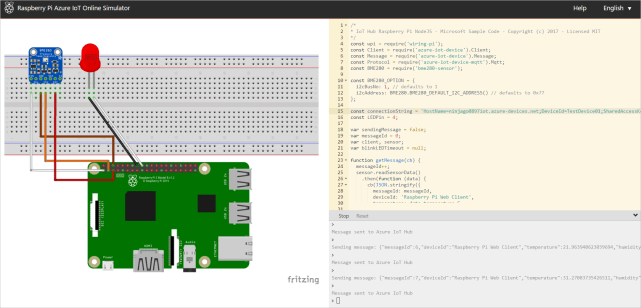
This blog post gives a demo on the ANOMALYDETECTION operator with an example that detect anomalies in a temperature sensor events flow. The sensor data will be generated by the Raspberry Pi Azure Iot Online Simulator , and sent to the IoT hub.
An Azure Stream Analytics input will be created to consume the temperature data from the IoT hub, and a Power BI output will be created to output the temperature anomaly alerts.

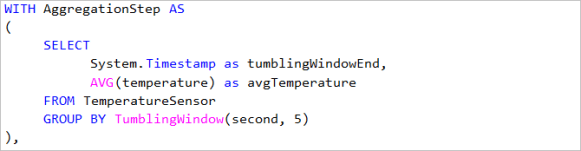
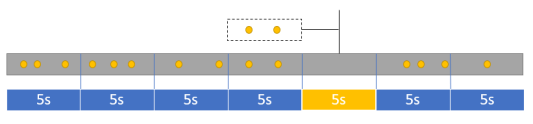
A prerequisite for ANOMALYDETECTION operator to work is that the input time series needs to be uniform. We can use tumbling window to uniform the time series by averaging the temperature within n seconds window.
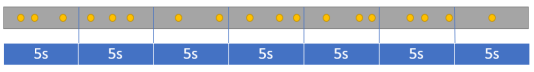
To fill the window with no sensor data flowing in, we can use the last window where sensor data is available.
We can then use the ANOMALYDETECTION operator to compute the anomaly scores within the time window of last n minutes/hours and extract the BiLevelChangeSocore, SlowPosTrendScore, and SlowNegTrendScore.

Finally, we can check the scores against the threshold set for alert. The recommended range of the threshold from Microsoft is between 3.25 and 5.
The full code can be found here:
| WITH AggregationStep AS | |
| ( | |
| SELECT | |
| System.Timestamp as tumblingWindowEnd, | |
| AVG(temperature) as avgTemperature | |
| FROM TemperatureSensor | |
| GROUP BY TumblingWindow(second, 5) | |
| ), | |
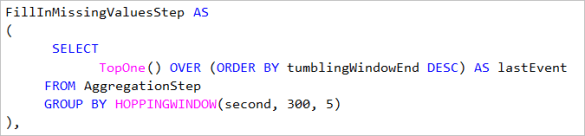
| FillInMissingValuesStep AS | |
| ( | |
| SELECT | |
| TopOne() OVER (ORDER BY tumblingWindowEnd DESC) AS lastEvent | |
| FROM AggregationStep | |
| GROUP BY HOPPINGWINDOW(second, 300, 5) | |
| ), | |
| AnomalyDetectionStep AS | |
| ( | |
| SELECT | |
| lastEvent.tumblingWindowEnd as anomalyTime, | |
| system.timestamp as anomalyDetectedTime, | |
| lastEvent.avgTemperature as avgTemperature, | |
| ANOMALYDETECTION(lastEvent.avgTemperature) OVER (LIMIT DURATION(minute, 10)) as scores | |
| FROM FillInMissingValuesStep | |
| ), | |
| OutputSet AS | |
| ( | |
| SELECT | |
| anomalyTime, | |
| anomalyDetectedTime, | |
| avgTemperature, | |
| CAST(GetRecordPropertyValue(scores, 'BiLevelChangeScore') as float) as [Bi Level Change], | |
| CAST(GetRecordPropertyValue(scores, 'SlowPosTrendScore') as float) as [Slow Postive Trend], | |
| CAST(GetRecordPropertyValue(scores, 'SlowNegTrendScore') as float) as [Slow Negative Trend] | |
| FROM AnomalyDetectionStep | |
| ) | |
| SELECT | |
| anomalyTime, | |
| anomalyDetectedTime, | |
| avgTemperature, | |
| [Bi Level Change], | |
| [Slow Postive Trend], | |
| [Slow Negative Trend], | |
| CASE | |
| WHEN [Bi Level Change]>3.25 AND [Bi Level Change]> [Slow Postive Trend] AND [Bi Level Change]> [Slow Negative Trend] | |
| THEN 'Bi Level Change' | |
| WHEN [Slow Postive Trend]>3.25 AND [Bi Level Change]< [Slow Postive Trend] AND [Slow Postive Trend]> [Slow Negative Trend] | |
| THEN 'Slow Postive Trend' | |
| WHEN [Slow Postive Trend]>3.25 AND [Bi Level Change]< [Slow Negative Trend] AND [Slow Postive Trend]< [Slow Negative Trend] | |
| THEN 'Slow Negative Trend' | |
| ELSE '' | |
| END AS anomalyType | |
| INTO TelemetryAlert | |
| FROM OutputSet |
https://gist.github.com/malinxiao/f9e00fc6e805bc48adef947815907da1#file-anomalydetection-asaql
After start the stream analytics job, the temperature measure data with the anomaly scores will flow into Power BI.

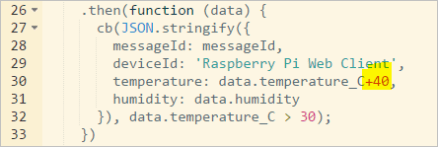
We can create anomalies through changing the temperature value generated by the simulator.