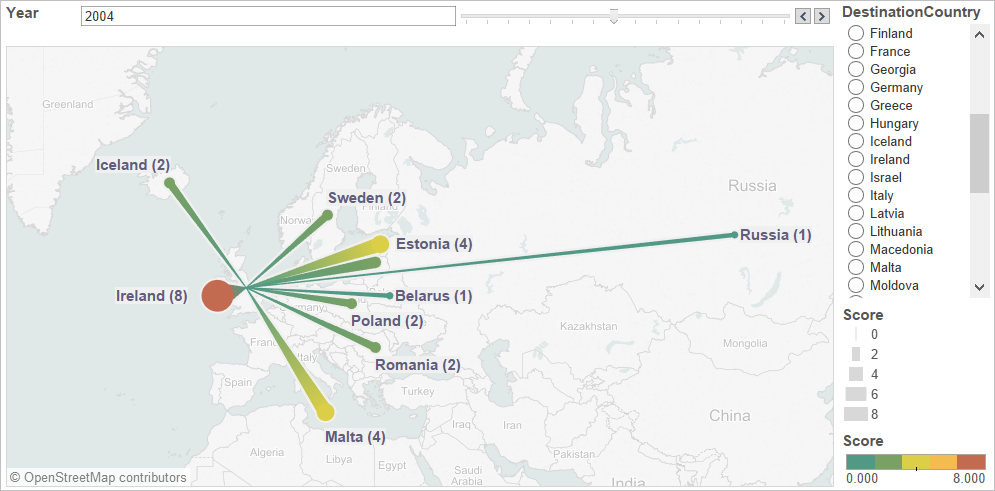
In the last blog post, I’ve created a box-and-whisker plot to compare UK’s performance on Eurovision contest with others. That would be good to have a nice Viz to show where the votes from for each country. This can be achieved using Tableau Map and Path.
It is straightforward to create this Viz using the Path Shelf on Tableau. However, we need have the source data in the right structure. The snapshot below shows the structure of original raw data for Eurovision final voting. Each vote is stored in a single row with the [Country] column storing where the score was given to and the [Giver] column storing where the score was given from.

To use the Path feature in Tableau, we need transform the vote row into two rows, one row stores details for the start point of the path and the other is for the destination point of the path. the snapshot below shows the required data structure for the Viz.

To transform the data structure, I have loaded the original Eurovision voting data into SQL Server and create a Stored Procedure to output the data in the required structure.

The original vote row is UNPIVOT on the [Country] and [Giver] column and generate two rows with details on where the vote is from and to. For each path pair, we need give them a unique [Path ID] and also assign the [Path Order] to the Start and To row. We can have the actual [Score] number on the [Giver] row so that we can assign the SUM([Score]) value to Size of the Start point to represent the size of voting score.
