
Credit Migration Analysis with Credit Transition Matrix is discussed in the CFA Fixed Income, Module 4, Section 3, “Credit Scores and Credit Ratings”. Credit migration refers to changes in the credit rating of a bond issuer, which can impact the value and expected returns of an investment. A Credit Transition Matrix is a tool used in credit migration analysis to model the likelihood of changes in a bond issuer’s credit ratings over a specified period.
In this blog post, I will replicate the example (Exhibit 7) presented in the CFA curriculum book using Python code.
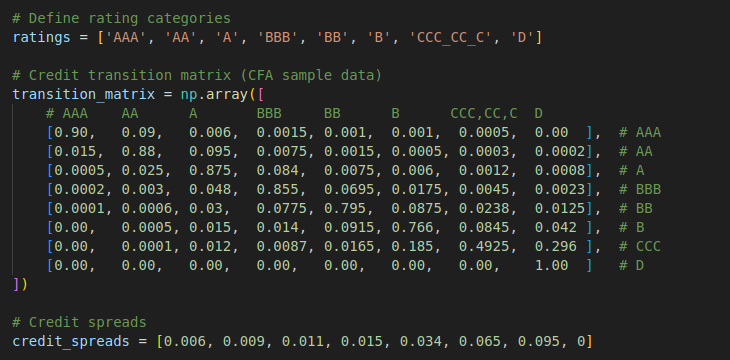
First, we need to model the credit transition matrix of the assumed bond issuer provided in the CFA example. We can use a two-dimensional array to represent the transition matrix, where the rows correspond to the credit ratings from which migration occurs, and the columns correspond to the credit ratings to which migration occurs, and the cell represents the probability of the credit rating change. Additionally, we will use a one-dimensional array to store the rating headers and the credit spreads corresponding to each rating.
Once we have the credit transition matrix, the two key questions we want to answer are:
- What is the potential bond value loss in the event of credit migration, regardless of which credit rating the bond migrates to?
- How much bond value loss might occur when the credit rating migrates to a specific rating?
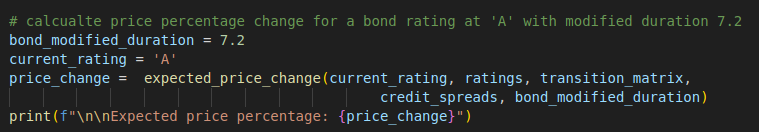
The first question is important for risk management, as it helps quantify the potential portfolio loss due to credit rating changes. The potential loss for a bond, such as an ‘A’ rated 10-year corporate bond with a modified duration of 7.2 (as shown in the CFA curriculum book example), can be calculated by multiplying each expected percentage price change for a possible credit transition by its respective transition probability, as found in the transition matrix. The expected percentage price change for a possible credit transition can be calculated as:
Duration * (Credit Spread of Rating_to – Credit Spread of Rating_from)
Here, we can create a function that take the current credit rating as input and output the potential bond value percentage change.

Here, we use the bond parameters provided in the CFA curriculum book and call the function.

For the second question, “How much bond value loss might occur when the credit rating migrates to a specific rating?”, we can derive a price change matrix to show the bond value change for each credit rating change possibility.

The code implementation is straightforward. We simply need to loop through each credit transition possibility, calculate the percentage change in value using the formula above, and store the result in the corresponding cell.

Full Code – Python
import numpy as np
import pandas as pd

# calculate price change due to credit transition
def expected_price_change(
        current_rating,          # the rating from which the credit transits
        ratings,                 # ratings list
        transition_matrix,       # transition matrix
        credit_spreads,          # credit spread for each rating
        bond_modified_duration): # modified duration of the bond

    index_current_rating = ratings.index(current_rating)

    total_price_change = 0.0
    for c in range(len(ratings) - 1):
        possiblity = transition_matrix[index_current_rating][c]
        credit_spread_change = credit_spreads[c] - credit_spreads[index_current_rating]
        price_change = (- bond_modified_duration
                            * credit_spread_change
                            * possiblity)
        total_price_change += price_change

    return total_price_change

# generate price change matrix
def generate_price_change_matrix(
        ratings,                 # ratings list
        transition_matrix,       # transition matrix
        credit_spreads,          # credit spread for each rating
        bond_modified_duration): # modified duration of the bond

    price_change_matrix = np.zeros((len(ratings), len(ratings)))
    for r in range(len(ratings)):
        for c in range(len(ratings)):
            possiblity = transition_matrix[r][c]
            credit_spread_change = credit_spreads[c] - credit_spreads[r]
            price_change = (- bond_modified_duration
                            * credit_spread_change
                            * possiblity)
            price_change_matrix[r, c] = price_change

    return price_change_matrix


# Define rating categories
ratings = ['AAA', 'AA', 'A', 'BBB', 'BB', 'B', 'CCC_CC_C', 'D']

# Credit transition matrix (CFA sample data)
transition_matrix = np.array([
    # AAA    AA      A       BBB     BB      B      CCC,CC,C  D
    [0.90,   0.09,   0.006,  0.0015, 0.001,  0.001,  0.0005,  0.00  ],  # AAA
    [0.015,  0.88,   0.095,  0.0075, 0.0015, 0.0005, 0.0003,  0.0002],  # AA
    [0.0005, 0.025,  0.875,  0.084,  0.0075, 0.006,  0.0012,  0.0008],  # A
    [0.0002, 0.003,  0.048,  0.855,  0.0695, 0.0175, 0.0045,  0.0023],  # BBB
    [0.0001, 0.0006, 0.03,   0.0775, 0.795,  0.0875, 0.0238,  0.0125],  # BB
    [0.00,   0.0005, 0.015,  0.014,  0.0915, 0.766,  0.0845,  0.042 ],  # B
    [0.00,   0.0001, 0.012,  0.0087, 0.0165, 0.185,  0.4925,  0.296 ],  # CCC
    [0.00,   0.00,   0.00,   0.00,   0.00,   0.00,   0.00,    1.00  ]   # D
])

# Credit spreads
credit_spreads = [0.006, 0.009, 0.011, 0.015, 0.034, 0.065, 0.095, 0]

# calcualte price percentage change for a bond rating at 'A' with modified duration 7.2
bond_modified_duration = 7.2
current_rating = 'A'
price_change =  expected_price_change(current_rating, ratings, transition_matrix,
                                            credit_spreads, bond_modified_duration)
print(f"\n\nExpected price percentage: {price_change}")

# generate price change matrix
price_change_matrix = generate_price_change_matrix(ratings, transition_matrix,
                                                credit_spreads, bond_modified_duration)

# Convert matrix to pandas dataFrame
transition_df = pd.DataFrame(transition_matrix, index=ratings, columns=ratings)
price_change_df = pd.DataFrame(price_change_matrix, index=ratings, columns=ratings)

# Print the transition matrix and price changes
print("\n\nCredit Transition Matrix:")
print(transition_df)
print("\n\nPrice Changes Matrix:")
print(price_change_df)
print("\n\n")
