
The concept of Key Rate Duration is discussed in the CFA, Fixed Income, module 1, section 8, “The Maturity Structure of Yield Curve Volatilities” and module 3, section 7, “One-Sided and Key Duration”.
In the real world, the yield curve does not always shift in parallel. Instead, different maturities may experience varying changes in interest rates. Key Rate Duration (KRD) is the metric used to measure the impact of non-parallel shifts in the yield curve. It represents the sensitivity of a bond’s price to changes in interest rates at specific points along the yield curve.
The calculation of KRD is straightforward. For each key rate, the bond’s price is recalculated by assuming a small change in that rate while holding other rates constant. The resulting price changes are then expressed as durations for each key rate.
In this blog, I will code one of the examples presented in the CFA curriculum, Exhibit 23, Section 7, Module 3, Fixed Income. This example discusses and compares the Key Rate Durations (KRDs) of a 10-year bond valued at a flat 4% yield curve with a variety of coupon rates. The chart below shows the output of the code we are writing.

For this example, we will calculate the KRDs for each year within a 10-year period.

Instead of looping through the years and creating bond and term structure instances for each year, we will leverage the observer pattern supported by QuantLib, which simplifies the code in a more elegant and efficient manner.
With the observer pattern in QuantLib, we can designate market data, such as rates and stock quotes, as observable. Any changes to this data will be automatically communicated to the objects (observers) that are subscribed to them. Due to the lazy loading mechanism, observers do not immediately update their state. Instead, they mark the dependent structure as “dirty” and only recalculate when a specific result is requested.
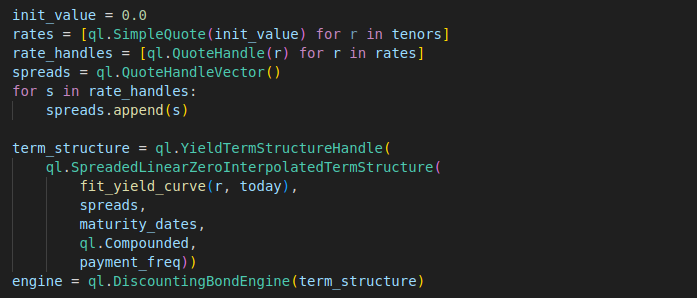
In our example, we create a QuoteHandle instance for each rate quote. The QuoteHandle is a key component in QuantLib that supports the observer pattern by wrapping a quote, tracking any changes to it, and notifying any objects referencing the QuoteHandle when the quote changes. We then create a QuoteHandleVector instance to store the list of QuoteHandle instances for each rate quote.
When calculating the KRD for a specific rate, we need to keep the rates at all other maturities unchanged and only adjust the target rate. To simplify the coding, we use the SpreadLinearZeroInterpolatedTermStructure, which represents a yield curve with a spread applied to a base term structure. By binding the QuotehandleVector we create earlier as the spread in the term structure, the structure will be notified whenever the rate changes.
Based on the term structure, we create the price engine and link to a bond instance. The bond instance is created specifically to facilitate the calculation of the KRD. Please refer to the full version of code attached at the bottom of this page, for more details on the bond instance creation.

Up to this point, we have created a bond instance that observes changes in the rate quote. This means that any rate change will automatically notify the bond instance. As a result, calculating the KRD becomes straightforward: we simply update the rate for a specific maturity, and accessing the bond’s price will automatically trigger a recalculation based on the updated rate. Following the duration calculation formula, we can increase the target rate by X basis points and calculate the bond price, price_r_up, then decrease the target rate by X basis points and calculate the bond price, price_r_down, and calculate the duration as: (price_r_down – price_r_up) / (2 * X * bond price at the original rate).

Full Code – Python
import QuantLib as ql
import numpy as np
import matplotlib.pyplot as plt

# calculate key rate durations
def calculate_KRDs(bond, rates, bp=0.003):

    def calculate_KRD(bond, rate, bp):
        rate.setValue(bp)
        price_r_up = bond.dirtyPrice()
        rate.setValue(-bp)
        price_r_down = bond.dirtyPrice()
        rate.setValue(init_value)
        price = bond.dirtyPrice()

        return (price_r_down-price_r_up) / (2.0 * bp * price)

    return [calculate_KRD(bond, r, bp) for r in rates]


# Fit yield curve
def fit_yield_curve(rate, evaluate_date):
    curve = ql.FlatForward(evaluate_date, rate, ql.Actual360())
    return ql.YieldTermStructureHandle(curve)

# create the bond instance
def create_bond(settlement_days, face_value, schedule, coupon_rate,
                day_counter):

    bond = ql.FixedRateBond(
        settlement_days,
        face_value,
        schedule,
        [coupon_rate],
        day_counter)

    return bond

# Utilty function for drawing line chart
def draw_chart(title, x_data, x_title, y1, y1_title, y2_data=None, y2_title=None, x_invert=False):

    fig, ax1 = plt.subplots(figsize=(8, 4))

    for y in y1:
        ax1.plot(x_data, y[0], label=y[1], color=y[2], linewidth=2)
    ax1.set_xlabel(x_title, fontsize=12)
    ax1.set_ylabel(y1_title, color='b', fontsize=12)
    ax1.tick_params(axis='y', labelcolor='b')
    ax1.grid(True)

    if y2_data is not None:
        ax2 = ax1.twinx()
        ax2.plot(x_data, y2_data, label=y2_title, color='red', linewidth=2)
        ax2.set_ylabel(y2_title, color='red', fontsize=12)
        ax2.tick_params(axis='y', labelcolor='red')

    if x_invert:
        ax=plt.gca()
        ax.invert_xaxis()
    plt.legend()
    plt.title(title, fontsize=16)
    fig.tight_layout()
    plt.show()


# Set evaluation date for QuantLib
today = ql.Date(23, 12, 2024)
ql.Settings.instance().evaluationDate = today

################################################
#              Define the Bond terms           #
################################################

# Define the bond terms
face_value = 100
coupon_rate = 0.05
settlement_date = ql.Date(15, 12, 2024)
settlement_days = 1
maturity_date = ql.Date(15, 12, 2034)
calendar = ql.UnitedStates(ql.UnitedStates.NYSE)
day_counter = ql.ActualActual(ql.ActualActual.Bond)
payment_freq = ql.Annual

# Define the cashflow schedule
schedule = ql.Schedule(
        settlement_date,
        maturity_date,
        ql.Period(payment_freq),
        calendar,
        ql.Unadjusted,
        ql.Unadjusted,
        ql.DateGeneration.Backward,
        False
)

coupon_rates = [0.02, 0.04, 0.06, 0.08, 0.1]

tenors = [1, 2, 3, 4, 5, 6, 7, 8, 9, 10]
maturity_dates = [calendar.advance(settlement_date, ql.Period(i, ql.Years))
                                   for i in tenors]

r = 0.04

init_value = 0.0
rates = [ql.SimpleQuote(init_value) for r in tenors]
rate_handles = [ql.QuoteHandle(r) for r in rates]
spreads = ql.QuoteHandleVector()
for s in rate_handles:
    spreads.append(s)

term_structure = ql.YieldTermStructureHandle(
    ql.SpreadedLinearZeroInterpolatedTermStructure(
        fit_yield_curve(r, today),
        spreads,
        maturity_dates,
        ql.Compounded,
        payment_freq))
engine = ql.DiscountingBondEngine(term_structure)

krd_bond = []
for c in coupon_rates:

    bond = create_bond(settlement_days,
                        face_value, schedule, c, day_counter)
    bond.setPricingEngine(engine)

    KRDs = calculate_KRDs(bond, rates, 0.003)

    krd_bond.append(KRDs)

colors = ['blue','orange','red','yellow','green']
draw_chart("", tenors, "Tenor",
           [(krd_bond[i], coupon_rates[i], colors[i] ) for i in range(5)], "KRD")
