
The spot curve forms the foundation for pricing fixed income securities and interest rate-related instruments. It represents the yields on zero-coupon bonds across various maturities under current market conditions. By using the spot curve to discount the cash flows generated by these securities, we can derive their prices. The other rate, such as forward rates, can be derived from the spot rate curve.
Spot curve fitting is the process of determining the spot rates for a range of maturities based on observed bond prices in the market. In this blog post, I will walk through the code implementation of spot curve fitting using the bootstrapping method, which calculates the spot rate for each maturity sequentially, using shorter-term bonds to derive longer-term rates.
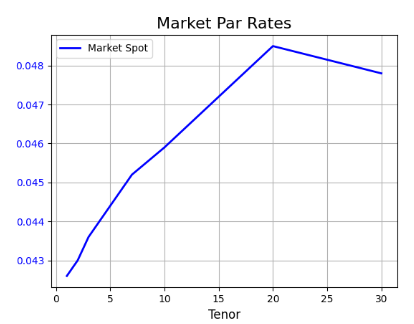
Assuming we have now observed the market rates for the par bonds at a set of different maturities, we want to derive the spot rate curve from these par rates. Par bonds are bonds priced at their face value.

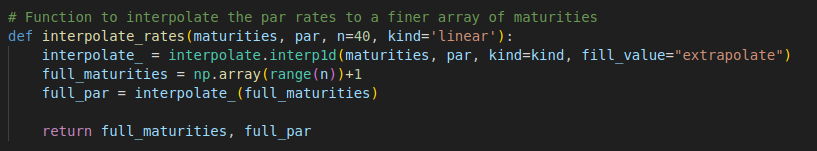
First, we interpolate the set of par rates to a finer array of maturities. For now, we just use a simple linear piecewise interpolation method as a starting point. I will gradually introduce the more advanced curve fitting methods in the future blog posts.
Then we loop through each maturity and calculate the spot rate corresponding to the given par rate at that maturity.

For the first maturity, the spot rate is simply the par rate.

For longer maturities, we can derive the spot rate using the par bond pricing formula, as shown below. The C coupon rate is given (i.e., the par rate at that maturity), and the spot rates of earlier maturities have been calculated in the earlier iterative steps.

We can transform the formula slightly to make it suitable for coding.

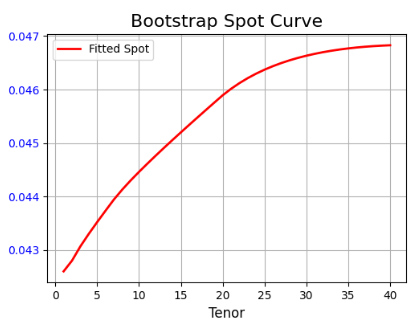
The same process will be repeated until the spot rates of all the longer maturities have been derived. The diagram below shows the fitted spot curve. The full Python and DolphinDB code created for this blog post can be found at the bottom of this page.
Full Code – Python
import numpy as np
import pandas as pd
from scipy import interpolate
import matplotlib.pyplot as plt

# Function to interpolate the par rates to a finer array of maturities
def interpolate_rates(maturities, par, n=40, kind='linear'):
    interpolate_ = interpolate.interp1d(maturities, par, kind=kind, fill_value="extrapolate")
    full_maturities = np.array(range(n))+1
    full_par = interpolate_(full_maturities)

    return full_maturities, full_par

# Function to calculate spot rates using bootstrapping
def bootstrap_spot_curve(maturities, pars, n=40, interpolate_method='linear'):

    full_maturities, full_pars = interpolate_rates(maturities, pars, n=n, kind=interpolate_method)

    spot_rates = []
    for i in range(len(full_maturities)):

        if i == 0:
            spot_rate = full_pars[i]
        else:
            coupons_pv = 0

            # Loop through previous maturities to calculate the sum of present values of coupons
            for j in range(i):
                coupons_pv += full_pars[i] / (1 + spot_rates[j]) ** full_maturities[j]

            spot_rate = ((1 + full_pars[i]) / (1-coupons_pv)) ** (1/full_maturities[i]) -1

        spot_rates.append(spot_rate)

    return full_maturities, spot_rates

def draw_chart(title, x_data, x_title, y1, y1_title, y2_data=None, y2_title=None, x_invert=False):

    fig, ax1 = plt.subplots(figsize=(8, 4))

    for y in y1:
        ax1.plot(x_data, y[0], label=y[1], color=y[2], linewidth=2)
    ax1.set_xlabel(x_title, fontsize=12)
    ax1.set_ylabel(y1_title, color='b', fontsize=12)
    ax1.tick_params(axis='y', labelcolor='b')
    ax1.grid(True)

    if y2_data is not None:
        ax2 = ax1.twinx()
        ax2.plot(x_data, y2_data, label=y2_title, color='red', linewidth=2)
        ax2.set_ylabel(y2_title, color='red', fontsize=12)
        ax2.tick_params(axis='y', labelcolor='red')

    if x_invert:
        ax=plt.gca()
        ax.invert_xaxis()
    plt.legend()
    plt.title(title, fontsize=16)
    fig.tight_layout()
    plt.show()


maturities = np.array([1, 2, 3, 5, 7, 10, 20, 30])
pars = np.array([p/100 for p in [4.26, 4.30, 4.36, 4.44, 4.52, 4.59, 4.85, 4.78]])

full_maturities, full_spots = bootstrap_spot_curve(maturities, pars)

draw_chart("Bootstrap Spot Curve", full_maturities, "Tenor",
           [(full_spots, "Fitted Spot", "red" )], "Rate")

draw_chart("Market Par Rates", maturities, "Tenor",
           [(pars, "Market Spot", "blue" )], "Rate")
Full Code – DolphinDB
// Function to interpolate the par rates to a finer array of maturities
def interpolate_rates(maturities, par, n=40, kind='linear'){

    model = piecewiseLinFit(maturities, par, 10)
    full_maturities = 1..n
    full_pars = model.predict(1..n)[0]

    return full_maturities, full_pars
}

// Function to calculate spot rates using bootstrapping
def bootstrap_spot_curve(maturities, pars, n=40, interpolate_method='linear'){

    full_maturities, full_pars = interpolate_rates(maturities, pars, n=n, kind=interpolate_method)

    spot_rates = array(DOUBLE)
    for (i in 0..(full_maturities.count()-1)) {
        if (i == 0) {
            spot_rate = full_pars[i]
        }
        else {
            coupons_pv = []
            for (j in [0..(i-1)]){
                coupons_pv = (full_pars[i] / pow((1 + spot_rates[j]), full_maturities[j]))
            }

            spot_rate = pow(((1 + full_pars[i]) / (1-sum(coupons_pv))), (1.0/full_maturities[i]))-1.0
        }

        spot_rates.append!(spot_rate)
    }

    return full_maturities, spot_rates
}

maturities = [1, 2, 3, 5, 7, 10, 20, 30]
pars = [0.0426, 0.0430, 0.0436, 0.0444, 0.0452, 0.0459, 0.0485, 0.0478]

full_maturities, full_spots = bootstrap_spot_curve(maturities, pars, n=40)

plot(full_spots)
