There is one important feature missing from Azure Data Factory. In SSIS, at the end of the ETL process when the new data has been transformed and load into data warehouse, the SSAS processing task can be run to process the cube immediately after the new data has flow into the data warehouse. However, Azure … Continue reading Trigger Azure Analysis Service Processing in Azure Data Factory
Author: Linxiao Ma
Build Custom Component Status Diagram for Power BI using Synoptic
One common visualisation requirements of IoT analytics is to display the current status of machine components using status diagram of the machine in an interactive reporting tool such as Power BI. The task to build custom machines diagram can be very time-consuming for report authors. Fortunately, I found we can actually build machine diagrams for … Continue reading Build Custom Component Status Diagram for Power BI using Synoptic

Issues with Azure Streaming Analytics + Power BI Real-Time Streaming for IoT Hot-Path Analytics
Event Hub+Azure Streaming Analytics+Power BI Real-Time Streaming is the recommended approach from Microsoft for IoT hot-path analytics. The combination of those techniques provides a simple and efficient way to implement streaming analytics. However, I did meet some issues with this approach when designing hot-path analytics solutions for IoT projects. Azure Streaming Analytics does not support … Continue reading Issues with Azure Streaming Analytics + Power BI Real-Time Streaming for IoT Hot-Path Analytics
Handling Across-Day Cycle Issue in Daily Usage Analysis using U-SQL
When analysing daily usage of a machine that can run across days, we need to split the time of a single machine running cycle into right days. As the example below shows, the second machine (D00002) run across two days and the third machine (D00003) run across three days. To analyse the daily usage of … Continue reading Handling Across-Day Cycle Issue in Daily Usage Analysis using U-SQL
Generate Device Cycle Records from Raw Telemetry Message using Azure Data Lake Analytics
The raw telemetry data collected from IoT sensor is normally event-based, e.g., a "Device On" message when the device starts to run, and a "Device Off" message when the device stops. One common data preprocessing task is to transform the raw "On/Off" telemetry data into device cycle records with the start time, end time and … Continue reading Generate Device Cycle Records from Raw Telemetry Message using Azure Data Lake Analytics
Workaround for Building Azure Data Warehouse using Visual Studio
When creating Azure Data Warehouse, I have found the limitation that the Visual Studio SSDT SQL projects does not support Azure Data Warehouse. It causes much pain to the data warehouse development without support on source control and nice code organisation as those offered by SSDT SQL Projects. Fortunately, I have found a trick to … Continue reading Workaround for Building Azure Data Warehouse using Visual Studio
Extracting Features from IoT Sensor Data using R
In my previous blog I introduced the common patterns to extract features from IoT sensor data using Python. Although R is not my primary machine learning language it is becoming ubiquitous in Microsoft's data analytics ecosystem after they acquired Revolution Analytics, the major commercial distributor of R. Considering the increasing popularity of R on Microsoft … Continue reading Extracting Features from IoT Sensor Data using R
Extracting Features from IoT Sensor Data using Python
The previous blog post discusses three common patterns for extracting feature from IoT sensor data: Window-based descriptive statistics Seasonal pattern Trend pattern This blog post introduces how to implement those three patterns in Python. Window-based descriptive statistics There are three main types of descriptive statistics based on what they describe: distribution (e.g., skewness and kurtosis), … Continue reading Extracting Features from IoT Sensor Data using Python
Feature Extraction of IoT Sensor Data
Feature extraction is an important step in IoT-related machine learning process that transforms the temporal data of machine component state into a format supported by machine learning algorithms. The extracted features need to be informative, i.e. need to carry the information that can contribute to the prediction. Due to the temporal characteristic of IoT sensor … Continue reading Feature Extraction of IoT Sensor Data
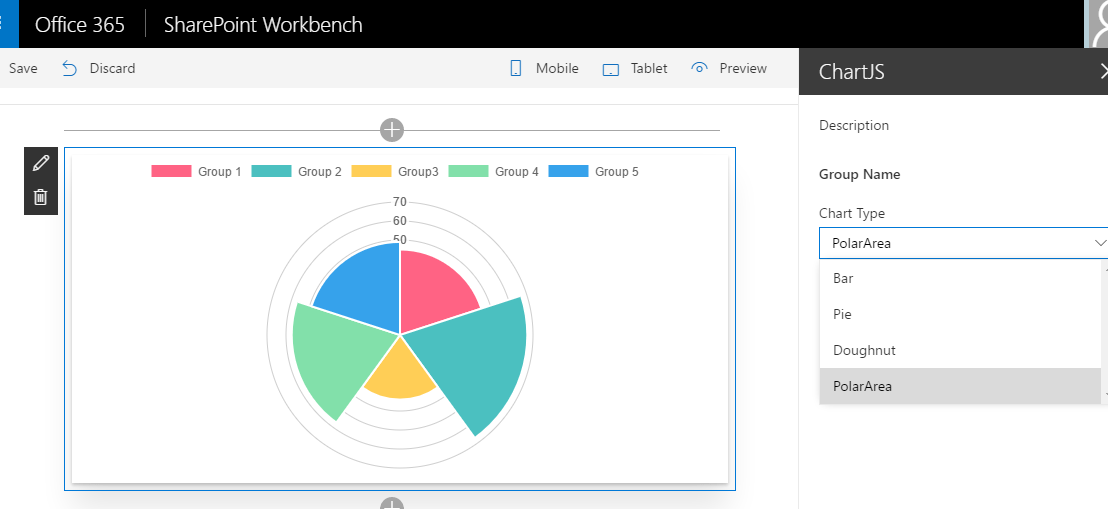
Building SPFx Client-Side Web Parts using Chart.js
Chart.js is a very handy Javascript charting library, lightweight, flexible, sleek UI and free of charge. In this blog post, I will walk through the steps to build SharePoint Framework client-side web parts using Chart.js library. I have created a demo client-side chart web part with the source code on github. This web part allows … Continue reading Building SPFx Client-Side Web Parts using Chart.js


You must be logged in to post a comment.