The previous blog post discusses three common patterns for extracting feature from IoT sensor data:
- Window-based descriptive statistics
- Seasonal pattern
- Trend pattern
This blog post introduces how to implement those three patterns in Python.
- Window-based descriptive statistics
There are three main types of descriptive statistics based on what they describe: distribution (e.g., skewness and kurtosis), central tendency (e.g., mean, median, and mode) and dispersion (e.g., standard deviation, variance, and Range). Python pandas package provides functions to a comprehensive list of descriptive statistics. You can find the reference to those functions here.
The descriptive statistics need to be calculated within a time window context, e.g., the last 12, 24, 72 hours. We can use the rolling method in pandas to get the rolling time window.
For example, we have the hourly reading data from sensor A: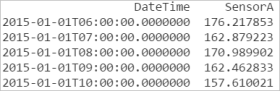
We can get the rolling window sizing as 12, 24, 72 hours and calculate the mean, sd, and skew of each window size.
data['SensorA_mean_12h'] = data['SensorA'].rolling(12).mean()
data['SensorA_sd_12h'] = data['SensorA'].rolling(12).std()
data['SensorA_skew_12h'] = data['SensorA'].rolling(12).skew()
data['SensorA_mean_24h'] = data['SensorA'].rolling(24).mean()
data['SensorA_sd_24h'] = data['SensorA'].rolling(24).std()
data['SensorA_skew_24h'] = data['SensorA'].rolling(24).skew()
data['SensorA_mean_72h'] = data['SensorA'].rolling(72).mean()
data['SensorA_sd_72h'] = data['SensorA'].rolling(72).std()
data['SensorA_skew_72h'] = data['SensorA'].rolling(72).skew()
data.tails(5)
The python code above will generate the features as:

- Seasonal pattern
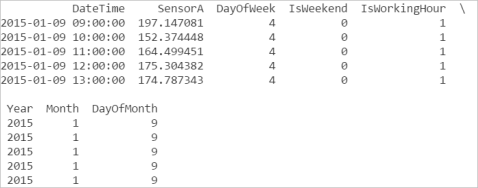
As discussed in last blog post, the features representing seasonal pattern can be extracted from the timestamp of the IoT sensor data using the built-in Python datatime class, such as:
data['DayOfWeek']=data['DateTime'].dt.weekday
data['IsWeekend']=np.where(data['DateTime'].dt.weekday>4, 1, 0)
data['IsWorkingHour']=np.where((data['DateTime'].dt.hour>=9) & (data['DateTime'].dt.hour<=17), 1, 0)
data['Year']=data['DateTime'].dt.year
data['Month']=data['DateTime'].dt.month
data['DayOfMonth']=data['DateTime'].dt.day
data.tail(5)
We can get the output as:
- Trend pattern
We can use shift function to extract the features for representing the trend pattern in a time-series dataset.
data['SensorA_lag_1h'] = data['SensorA'].shift(1)
data['SensorA_lag_2h'] = data['SensorA'].shift(2)
data['SensorA_lag_3h'] = data['SensorA'].shift(3)
data['SensorA_lag_4h'] = data['SensorA'].shift(4)
data['SensorA_lag_5h'] = data['SensorA'].shift(5)
data['SensorA_lag_6h'] = data['SensorA'].shift(6)
data['SensorA_lag_7h'] = data['SensorA'].shift(7)
data.tail(5)
We can the output as:

